- The text analytics reports provide an overview of student comments for all of your teaching over the past semester.
- The reports are useful primarily for formative purposes. They can help with quickly identifying perceived strengths and opportunities for development in one’s teaching based on the frequency of keywords and keyword combinations that appear in student comments. The corresponding attributes are derived from a dictionary that has been compiled on the basis of hundreds of thousands of student comments from multiple universities in North America, Australia, and elsewhere.
- The reports are especially useful for modules with large class sizes given the high volume of free-form comments, as they provide instructors with a quick summary of massive amount of data by categorisation. That said, it goes without saying that given enough time, humans tasked with reviewing free-form comments will always produce better results than even the most powerful computers. For example, if you have fewer than 50 comments then it might be a lot easier to read the actual comments than relying on categorisation. Thus, text analytics reports are not used for judging the quality of teaching, but are meant only for the eyes of teachers themselves to reflect on and, where necessary, improve their own teaching.
| Name of Teacher | Leong Wing Lup, Ben | ||
| Academic Year/Sem | - SEM | ||
| Department | COMPUTER SCIENCE | ||
| Faculty | SCHOOL OF COMPUTING | ||
| Raters | Student |
|---|---|
| Responded | 114 |
| Invited | 158 |
| Response Ratio | 72% |
Class Size = Invited; Response Size = Responded; Response Rate = Response Ratio
Attributes based on comments for "What are the teacher's strengths?"
The analysis is done by taking into consideration all responses from modules taught by you. This section of the report graphically represents how often particular attributes are identified in the freeform response data, and are displayed as a percentage of the number of response received. The frequency table displays the top five attributes from all the freeform comments categorized by the dictionary. We recommend that you pay attention to those attributes above 10% points.
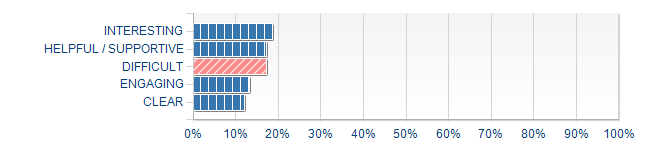

| Attributes [No. of comments] | Overall [75] |
|---|---|
| INTERESTING | 19 % |
| HELPFUL / SUPPORTIVE | 17 % |
| DIFFICULT | 17 % |
| ENGAGING | 13 % |
| CLEAR | 12 % |
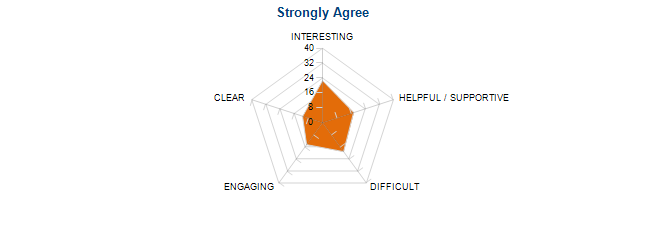
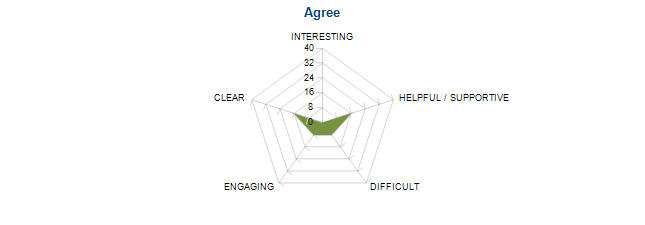
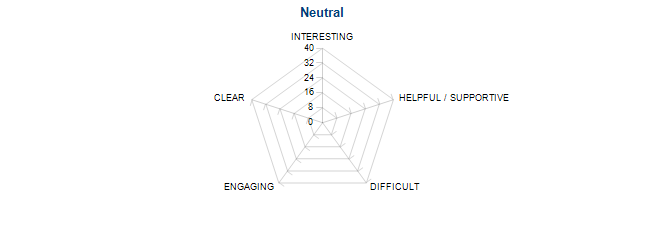
Comparison by Ratings
| Attributes [No. of comments] | Strongly Agree [62] | Agree [12] | Neutral [1] |
|---|---|---|---|
| INTERESTING | 23 % | 0 % | 0 % |
| HELPFUL / SUPPORTIVE | 18 % | 17 % | 0 % |
| DIFFICULT | 19 % | 8 % | 0 % |
| ENGAGING | 15 % | 8 % | 0 % |
| CLEAR | 11 % | 17 % | 0 % |
Comparison by Gender
| Attributes [No. of comments] | F [4] | M [71] |
|---|---|---|
| INTERESTING | 0 % | 20 % |
| HELPFUL / SUPPORTIVE | 0 % | 18 % |
| DIFFICULT | 0 % | 18 % |
| ENGAGING | 0 % | 14 % |
| CLEAR | 25 % | 11 % |
Attributes based on comments for "What are the teacher's strengths?"
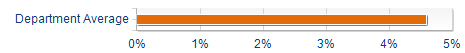
Listed below are the top 5 attributes voiced as positive aspects about all teachers in the department.
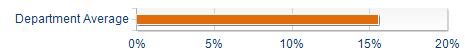

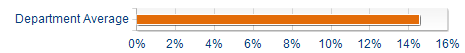

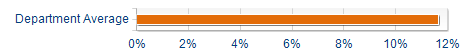
Gap Analysis based on comments for "What are the teacher's strengths"
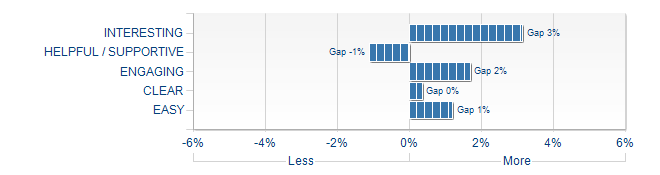
| Attributes [No. of comments] | Teacher Average [75] | Department Average [103] | Gap |
|---|---|---|---|
| INTERESTING | 19 % | 16 % | 3 % |
| HELPFUL / SUPPORTIVE | 17 % | 18 % | -1 % |
| ENGAGING | 13 % | 12 % | 2 % |
| CLEAR | 12 % | 12 % | 0 % |
| EASY | 8 % | 7 % | 1 % |
Comparison between Attributes from Qualitative Comments and Overall teacher effectiveness for "What are the teacher's strengths?
| Attributes [No. of comments] | Strongly Agree [62] | Agree [12] | Neutral [1] |
|---|---|---|---|
| INTERESTING | 23 % | 0 % | 0 % |
| HELPFUL / SUPPORTIVE | 18 % | 17 % | 0 % |
| DIFFICULT | 19 % | 8 % | 0 % |
| ENGAGING | 15 % | 8 % | 0 % |
| CLEAR | 11 % | 17 % | 0 % |
Attributes based on comments for "What improvements would you suggest for the teacher"
Listed below are the top 5 attributes voiced as negative aspects about all teachers in the department.
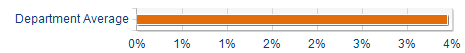
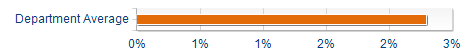


Gap Analysis based on comments for "What improvements would you suggest for the teacher"
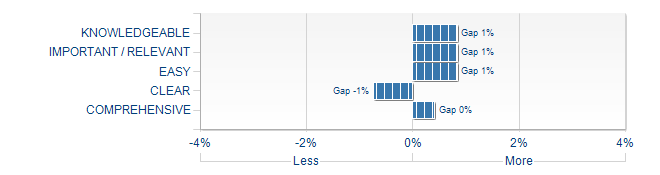
| Attributes [No. of comments] | Teacher Average [64] | Department Average [87] | Gap |
|---|---|---|---|
| KNOWLEDGEABLE | 3 % | 2 % | 1 % |
| IMPORTANT / RELEVANT | 3 % | 2 % | 1 % |
| EASY | 3 % | 2 % | 1 % |
| CLEAR | 2 % | 2 % | -1 % |
| COMPREHENSIVE | 2 % | 1 % | 0 % |
Attributes based on comments for "What improvements would you suggest to the teacher?"
Extensive data analysis across institutions that use student feedback have highlighted six items to which teachers may need to pay attention to.
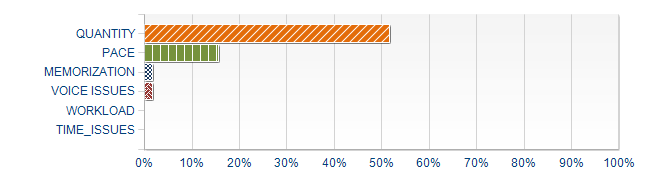
| Potential issues [No. of comments] | Overall [64] |
|---|---|
| QUANTITY | 52 % |
| PACE | 16 % |
| MEMORIZATION | 2 % |
| VOICE ISSUES | 2 % |
| WORKLOAD | 0 % |
| TIME_ISSUES | 0 % |