|
1
|
- Evaluation of Library Services
- Week 11 Min-Yen KAN
|
|
2
|
- Run as a business, need to justify costs and expenditure
- Quantitative data analysis necessitated by evolution into automated and
digital libraries
- Need benchmarks to evaluate effectiveness of library
|
|
3
|
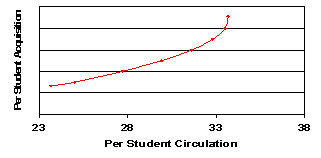
- Circulation per capita
- Library visits per capita
- Program attendance per capita
- Turnover rate
- Registration as % of population
- - Output measures for public libraries
- Zweizig and Rodger (1982)
|
|
4
|
- Macroevaluation
- Quantitative
- Degree of exposure
- Microevaluation
- Diagnostic
- Gives rationale for performance
|
|
5
|
- Axiom
- The more a book in a library is exposed, the more effective the
library.
- Defining “an exposure” as a simple count
- Pros
- Easy; can different levels of granularity
- Cons
- 5 × 1 day borrowing is five times more exposure than 1 × 5 day
borrowing
- Shorter circulation would increase counts
|
|
6
|
- Item-use days: Meier (61)
- A book borrowed for five days may not be used at all
- Effective user hours: De Prospo et al. (73)
|
|
7
|
- ___________________________, the greater the exposure.
|
|
8
|
- In general, more exact measures require sampling and tend towards
microevaluation
- So it’s a continuum after all
- Administrators use a battery of measures; not a single one, to measure
effectiveness – Spray (76)
|
|
9
|
- Quality
- Time
- Costs (including human effort)
- User satisfaction (ultimately, they are bearing the library’s operating
costs)
|
|
10
|
- The more concrete the need, the easier to evaluate
- Failure is harder to measure than success
- Case 1: Got a sub-optimal resource
- Case 2: Got some material but not all
|
|
11
|
- Technical Services Public Services
- Quality 1. Select and acquisition 1. Range of services offered
- Size, appropriateness, and 2.
Helpfulness of shelf order and
- balance of collection
guidance
- 2. Cataloging and Indexing 3. Catalog
- Accuracy, consistency, and
Completeness, accuracy and
- completeness ease of use
- 4. Reference and retrieval
- Completeness, accuracy
and
- percentage success
- 5. Document Delivery
- Percentage Success
- Time 1. Delays in Acquisition 1. Hours of Service
- 2. Delays in Cataloging 2. Response Time
- 3. Productivity of Staff 3. Loan Periods
- Cost 1. Unit cost to purchase 1. Effort of use
- 2. Unit cost to process
Location of library
- Accession Physical accessibility of collection
- Classify Assistance from staff
- Catalog 2. Charges Levied
|
|
12
|
- What’s the purpose…
- … of the collection
- Who’s the readership – academic, public?
- … of the evaluation
- Document change in demand?
- Justify funding?
- Select areas to weed materials?
- Adjust shelving/organization?
|
|
13
|
- Checklist
- Use standard reference bibliographies to check against
- Citation
- Use an initial seed of resources to search for resources that cite and
are cited by them
- Are these methods really distinct?
- How do people compile bibliographies in the first place?
|
|
14
|
- Circulation
- General
- Interlibrary Loan (ILL)
- In-house uses
- Stack
- Catalog
|
|
15
|
|
|
16
|
- Idea: Build the collection in parts
- Prioritize and budget specific subjects
- Shrink, grow, keep constant
- Evaluate subjects according to specific use
- Which courses it serves, what are each courses’ needs
|
|
17
|
- Age
- Language
- Subject
- Shelf Arrangement
- Quality
- Expected Use
- Popularity
- Information Chain placement
|
|
18
|
- Mostly done by sampling
- Table Counting
- Slip
- Interviews
- Observation
|
|
19
|
- The myth: If we have it, you can get it.
- The reality: If we have it, you have a chance of getting it.
|
|
20
|
|
|
21
|
|
|
22
|
- IR Evaluation Metrics
- Week 11 Min-Yen KAN
|
|
23
|
|
|
24
|
|
|
25
|
- Precision = Positive Predictive Value
- “ratio of the number of relevant documents retrieved over the total
number of documents retrieved”
- how much extra stuff did you get?
- Recall = Sensitivity
- “ratio of relevant documents retrieved for a given query over the
number of relevant documents for that query in the database”
- how much did you miss?
|
|
26
|
- Rank Decision R@r P@r
- 1 R 10% 100%
- 2 10% 50%
- 3 10% 33%
- 4 R 20% 50%
- 5 R 30% 60%
- 6 30% 50%
- 7 R 40% 57%
- 8 40% 50%
- 9 40% 44%
- 10 40% 40%
- 11 40% 36%
- 12 R 50% 42%
- 13 R 60% 46%
- 14 R 70% 50%
- …
- 22 R 100% 45%
|
|
27
|
- Interpolated precision
gives a non-increasing
curve
- But doesn’t factor in
the size of the corpus
- Previous example on a corpus of 25 docs = 40% precision
- On a corpus of
2.5 M docs = also 40%
|
|
28
|
- Look at how P/R or Sn/Sp varies as a function of rank:
- Choose a number of different ranks and calculate P/R or Sn/Sp
- Correspond to vertical lines on graphs at right
- Plot Sn vs. 1-Sp to get points for ROC curve. Interpolate curve.
|
|
29
|
- Look at the probability or rate of detection
- What does the
diagonal represent?
- How do we compare
ROC curves versus
each other?
|
|
30
|
- 11 pt average
- Average precision at each .1
interval in recall
- Precision at recall point (% or absolute)
- F Measure
- Ratio of precision to recall: Fb =
- (e.g., F3 = weight precision heavier)
- Area under ROC curve (Accuracy)
- 1 = perfect, .9 excellent, .5 worthless
|
|
31
|
- Witten, Moffat and Bell (99) Managing Gigabytes, Section 4.5
- Lesk (1997), Chapter 7, Usability and Retrieval Evaluation, Sections 7.6
- Baker and Lancaster (91) The Measurement and Evaluation of Library
Services, Information Resources Press
|

 Notes
Notes