Normal Behavior Monitor

NORT
User’s Guide
January 2010
© Copyright 2009-2010 National University of Singapore
Doc id:
Normal Behavior Monitor
NORT
User’s Guide
January 2010
© Copyright 2009-2010 National University of Singapore
Doc id:
Contents
Nort is a tool for establishing signatures of normal behaving applications and monitoring the current behavior of applications and checking against the learned specifications.
Traditional antivirus solutions require signatures of either
the malware binary or its behavior and fail to detect new malware or variants
of the same malware. Our approach on the malware detection problem starts from
the assumption that malware will be harmful to the normal
system and will cause changes to legitimate processes. We try to capture such
changes and examine how to better approximate a system’s normal behavior by
presenting NOrmal behavioR moniTor (NORT) real-time specification mining and
monitoring system.
Knowing the normal behavior of a system allows us to
determine if the system is acting abnormally. This is done by measuring the
deviation from normality, without the need of signatures. Our system first
constructs a model of the expected, normal behavior of applications, by
analyzing events that are generated during their normal operation and then
monitors all subsequent events to identify deviations, from the learned model.
The executables that are loaded into memory are scanned and specifications are
extracted as they run, without even using a sandbox.
Traces of system calls are used as input events and specifications in the form of patterns of system calls and entropy are extracted and used to profile and distinguish between acceptable and unacceptable behavior. We are proposing a new algorithm on mining minimal infrequent iterative sequential patterns and a novel application of mining infrequent and frequent patterns to security and malware detection. Our method will apply the principle of defense in depth and use the proven method of entropy along with knowledge discovery algorithms.
NORT’s architecture is comprised of several modules (as seen in Fig. 1):
1. The kernel-driver. The kernel instrumentation module is responsible for intercepting system calls and passing information about them to the engine.
2. The engine. The engine is the core of the system. It is built in a modular fashion to allow customization. Several modules have been implemented and others can be easily added to the engine’s processing pipeline. The first submodule, data preprocessing, is responsible for preprocessing the input system calls. Data from this module is passed through the modules responsible for profiling normal behavior, in the learning phase, and scanning for anomalous behavior, in the detecting phase: entropy and data miner. The entropy and miner submodules will store or query information from the storage submodule.
3. The user interface. The graphical user interface will allow the user to run experiments and capture system calls and we will discuss it in the next sections.
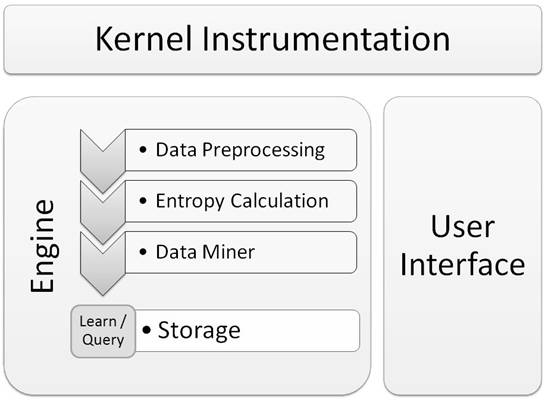
Figure 1 NORT architecture
The Nort Interface, implemented in C#, allows the user to perform the following tasks:
· Capture the execution traces generated by a set of processes in the form of system calls and their parameters, and store them to trace files.
· Extract from the trace files the process specifications and possibly consolidate them in a database of normal behaviors. The gui allows the user to manage this database (Learn, Load, Save, Clear).
· Given the database of normal behaviors and a new trace file Nort is able to scan and report abnormal behavior with regards to the specifications from the database.
In the following sections we will elaborate on these three points.
The Capture Tab, which can be seen in Figure 4, allows the user to intercept the input execution traces, formed by system calls and their parameters. The traces of system-calls are written to a file that the user can then learn or scan for malicious behavior in the Experiments Form. The default location for this file is in the same directory from which the application is run.
The Capture Tab also allows the user to configure and monitor the capture. The user is presented with the possibility to trace only a list a process, all process or none. There is a tradeoff between capturing the system calls from only a few processes at a time and monitoring all the processes. The first option allows the user to better exercise the functionality of the processes of interest with a small overhead on the system. On the other hand, capturing all processes causes a bigger overhead on the system due to the large quantity of data being transferred between kernel space and user space while providing coverage of the entire system.
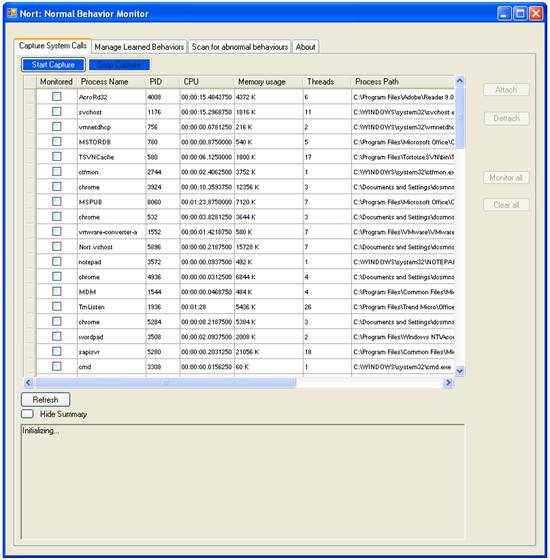
Figure 2. Capture Form
The first step in capturing the input system calls is starting the capture. This is accomplished by pressing “Start Capture” in the menu. After the Capture is started the “Attach”, “Detach”, “Monitor All” and “Clear All” buttons will become active allowing the user to select the processes to monitor.
The capture of system calls is accomplished, in our system, by the kernel driver and a technique called hooking. The kernel driver runs in kernel space, records the input events and passes them to the NORT core engine at designated intervals.
The first time NORT is run on a system and the capture is started the kernel driver “nortdrv.sys” gets installed as a service of the system with the name “nortdrv”. The installation requires that the nortdrv.sys file be in the same directory as the NORT application. If the installation is successful the service is started and will be polled by the NORT engine for data.
Following runs will only start the “nortdrv” service if the service is installed. They will require for the installation path of the “nortdrv.sys” driver not to change in order for the service to be started.
The result of the driver installation and the service start, can be seen in the Summary Text Box. In Figure 5 nortdrv.sys was successfully loaded.
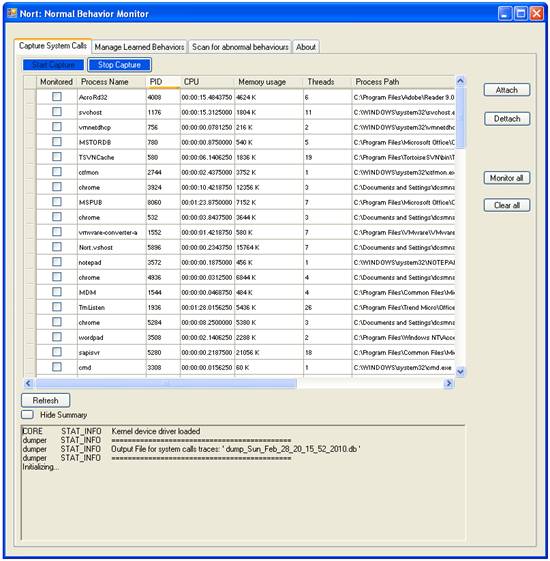
Figure 3. Start Capture
After finishing capturing execution traces the system calls can be unhooked by pressing “Stop Capture” in the menu. This is also done while closing the Capture Form is the capture is still running.
The capture of system calls is started with no processes being monitored. The user can selectively choose to monitor only a list of processes. This is done by selecting a list of processes from the displayed list of running processes and pressing the “Attach” Button.
The attachment to a process causes all system calls issued by that process to be monitored.
The user cannot monitor the NORT System and also the System Idle Process and the System process. The latter two although they appear in the displayed list of running processes are only default system counters.
The detachment from a process causes all system calls issued by that process not to be monitored. This is done by selecting a list of processes from the displayed list of running processes and pressing the “Detach” Button.
The monitoring of all processes implies that all system calls issued by user space applications are captured. This is achieved in NORT by pressing the “Monitor All “Button.
The difference between selecting all processes and attaching to them and “Monitor All” is that ,for the first case, the new processes will not be monitored from the time they are created, but at a possible latter time, when the user chooses so, and that for the “Monitor All” case the new processes are also monitored from the time they are created.
The clearing of all processes implies that none of the system calls issued by user space applications are captured. This is achieved in NORT by pressing the “Clear All “Button.
The list of running processes displayed in the Capture Form allows the user to selectively monitor processes but also to see the processes he is currently monitoring. For each process in the list information about the state “Monitored or Not”, the name and the path are displayed.
The list is not updated automatically and the refresh effect is achieved by pressing the “Refresh” Button
Our approach on the malware detection problem starts from the assumption that malware will be harmful to the normal system and will cause changes to legitimate processes. We try to capture such changes by approximating a system’s normal behavior.
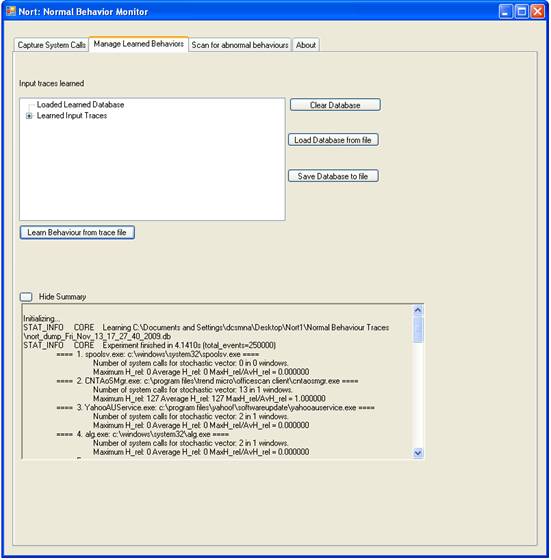
The “Manage Learned Behaviors” Tab allows the user to “Manage” the database of learned normal behavior. The “Scan for abnormal behaviors” Tab allows the user to “Scan” execution traces for anomalies.
As described in Section 3 the result of the monitoring consists in a trace of system calls stored in a trace file. These trace files become the source for extracting specifications of process behavior in the form of entropy and patterns of system calls. This specification inference takes place both in the learning and in the scanning task.
The specifications can be consolidated in a database of learned normal behaviors and thus form a signature of normal applications behavior that will be used as a reference for scanning. The database can be “Saved” to a file and “Loaded”. Once loaded the database can be enhanced by adding new specifications to it. This addition is done by extracting specifications from new trace files and learning them.
The database is used in order to allow subsequent “Scanning” experiments to just “Load” the stored database and not reenter the learning phase.
The Operations the user can perform on the database of learned normal behaviors are:
1. Learn or extract specifications from input trace file.
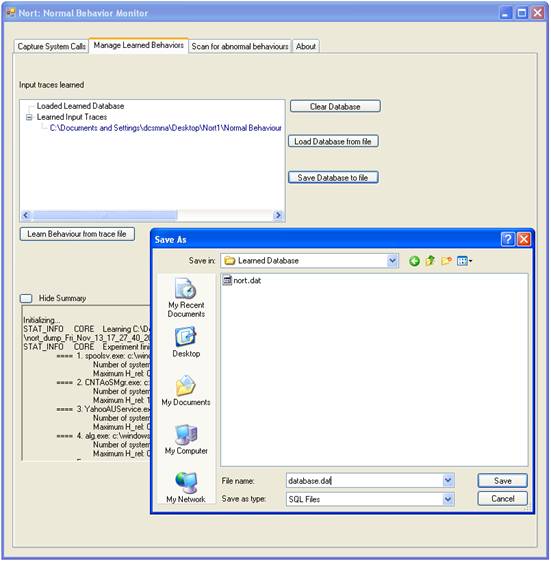
2. Save or store database to file.
3. Load previously stored database.
4. Clear database.
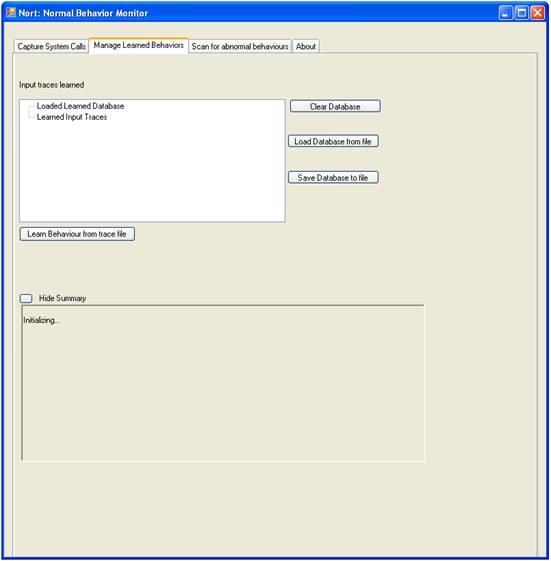
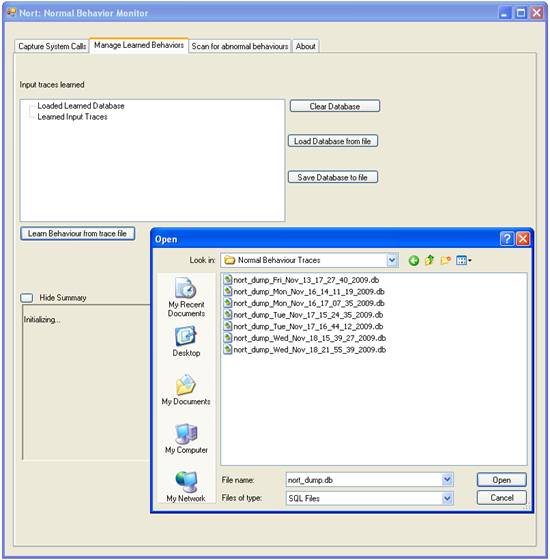
By pressing “Learn behavior from trace file” the user will be prompted by an Open File Dialog to select the file to learn. If the format of the input file is valid the file will be processed, specifications of behavior will be extracted, and a summary of the new database will be displayed in the Summary Box. If the file is not valid a message of “File not Valid” will be displayed.
By pressing “Save database” the user will be prompted by a Save File Dialog to select the file name the database will be saved to The saved database of learned normal behaviors can then be loaded so that subsequent experiments will not have to reenter the learning phase.
By pressing “Load database” the user will be prompted by an Open File Dialog to select the file to load. If the format of the input file is valid the file will be processed, the previously extracted specifications of behavior will be loaded to memory, and a summary of the loaded database will be displayed in the Summary Box. If the file is not valid a message of “File not Valid” will be displayed.
The database of learned normal behaviors can be initialized by pressing the Clear Database.
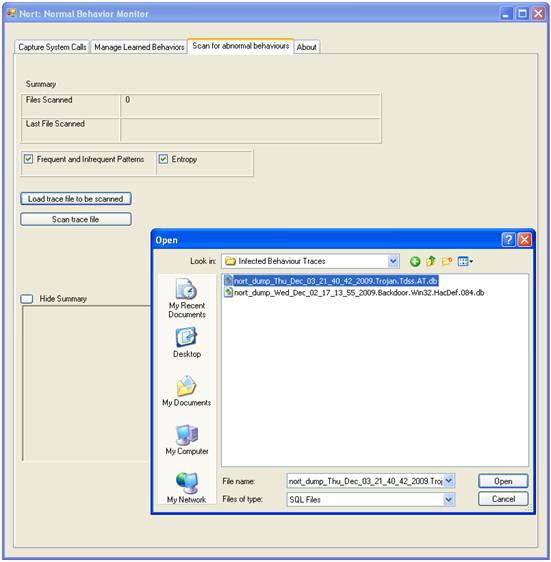
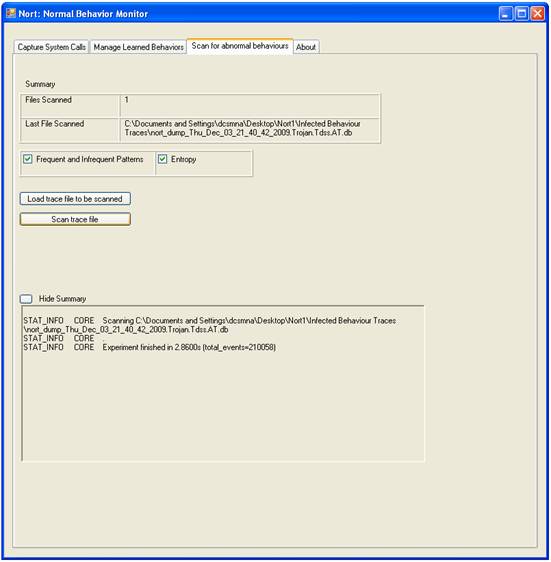
Scanning for anomalies is done based on input trace files recorded in the capture phase. The user is given the possibility to choose the layers of detection to use for scanning. Our system uses both entropy and data mining to profile normal and abnormal behavior.
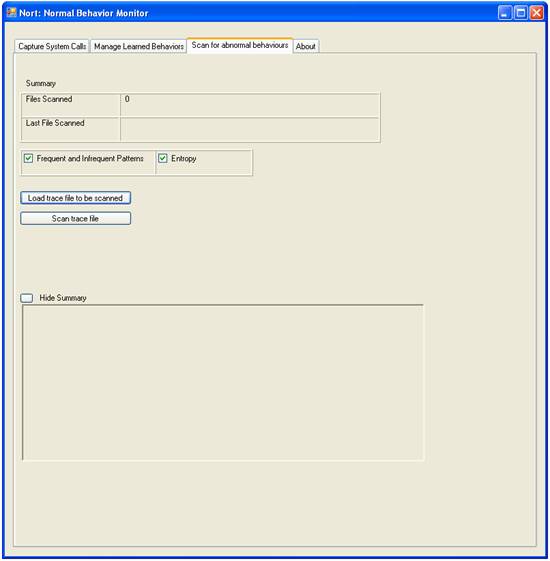
By pressing “Scan” the user will be prompted by an Open File Dialog to select the file of traces to scan.
 |
Uninstalling the systems implies removing nortdrv.sys which is installed the first time the NORT system runs as a service.
The
uninstalling of nortdrv.sys
is done by using a command line utility Sc, which is provided in the Windows Resource
Kit and which implements calls to all of the Windows service control
application programming interface (API) functions.
In order to delete the service the user must:
1. Go to the Start menu and press Run.
2. Type “cmd”.
3. Run the command “sc delete nortdrv”.
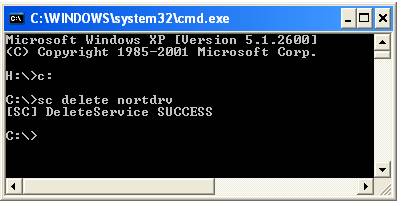
As a result the service will be marked for deletion and will be removed the at the next system startup.
System Calls in computing, refer to the mechanism used by an application program to request services from the operating system based on the monolithic kernel or to system servers on operating systems based on the microkernel-structure. System calls represent the interface between user space and kernel space. A system call is a request made by any program to the operating system for performing tasks—picked from a predefined set—which the said program does not have required permissions to execute in its own flow of execution. System calls provide the interface between a process and the operating system. Most operations interacting with the system require permissions not available to a user level process, e.g. I/O performed with a device present on the system or any form of communication with other processes requires the use of system calls.
Examples of system calls on Windows include : NtOpenFile, NtClose, NtCreateThread, NtOpenThread etc. The full list of system calls can be found here http://www.metasploit.com/users/opcode/syscalls.html
Database of learned normal behavior refers to the database built during the learning phase by extracting specifications, in the form of entropy and patterns of system calls, from the traces of system calls captured during the exercising of the normal system.
Input execution trace files refer to the traces of system calls captured by the kernel driver and used as input for both the learning and the detecting phases of our system.