


|
|
|---|
|
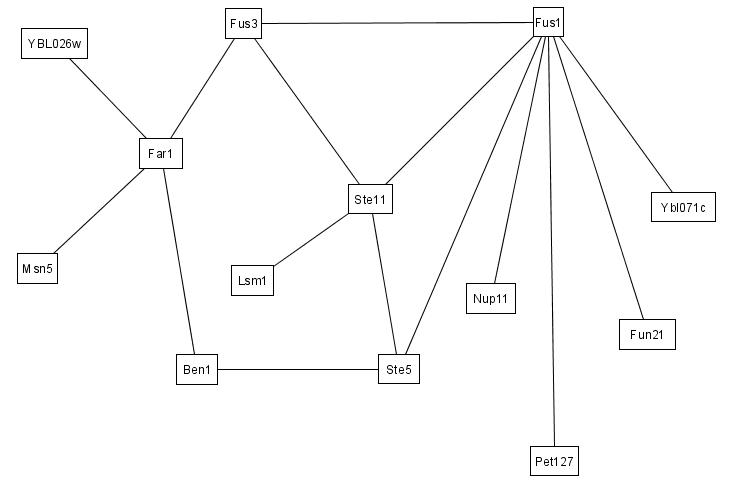
We illustrate here how IRAP and IRAP* works using real PPIs from our Saccharomyces cerevisiae dataset. For clarity, we only show the subset of PPIs between 14 proteins. The original interaction (sub)network between these proteins, as detected by Y2H screens, is shown in the figure below.
|
|
|
|
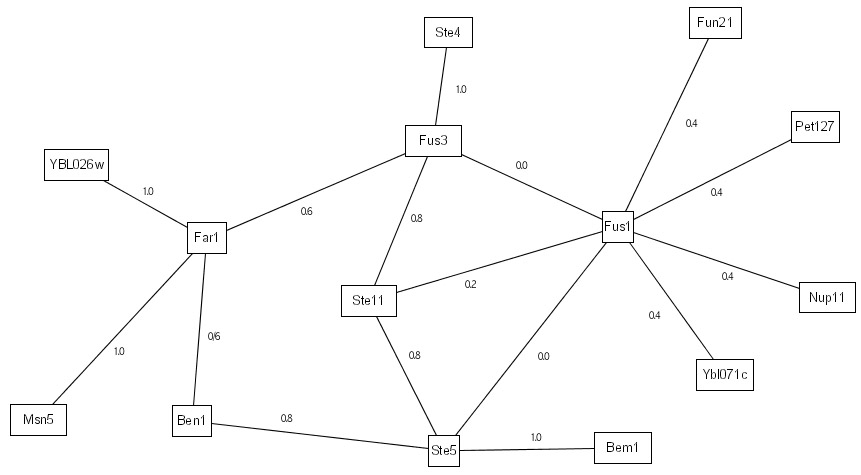
Our previous work on IRAP only does a single-pass evaluation on the interactome to detect potential false positives. First, it ranks the various detected interactions with an IG1-based initial weight as follows:
We then perform the IRAP algorithm to compute the interaction reliability values for the various interactions based on their alternative paths. The IRAP ranking of the interactions are as follows:
The above IRAP ranking can then be used as a reliability index to filter potential false positives (those with low IRAP values) from the detected interactome. Our previous works reported biological evidence based on functional homogeneity, cellular colocalization, and gene co-expression that the IRAP-ranking is superior to corresponding rankings by IG1 and IG2. |
|
|
|
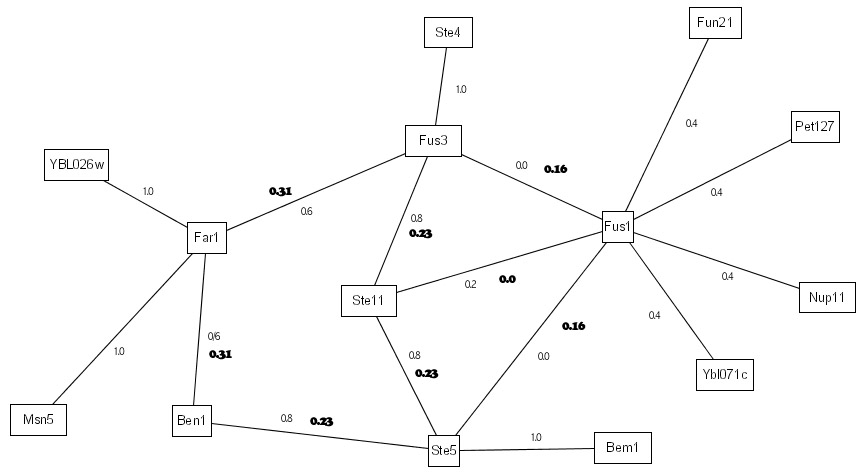
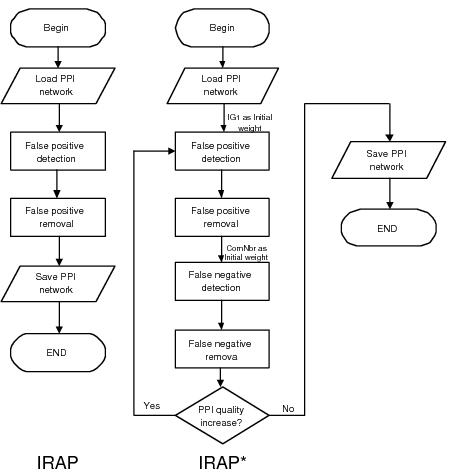
With IRAP*, we built on IRAP to formulate an iterative framework for removal of both false positives as well as false negatives. Removal of false positives is carried out in a similar fashion as the above - using IRAP with IG1-based initial weights. Removal of false negatives is carried out by computing a similar weight---in this case, it is IRAP with common neighbor counting instead of reversed IG1---for each of the undetected interactions in the interactome. Potential false positives are identified amongst the detected interactions as those with very low computed confidence values, while potential false negatives are discovered as the undetected interactions with high computed confidence values. Figure below shows the differences in IRAP and IRAP*:
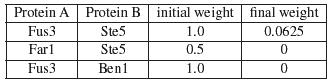
To continue with our previous example, in IRAP*, the interactions are first ranked as before. The bottom 1 interaction in the entire interactome is removed from the interactions. In our example, the interaction <Fus1,Ste11> belonged to the bottom spectrum and were removed from the network as false positives. Next, IRAP* computes the confidence values for the missing interactions using a different initial weight that is based on common neighborhood counting. In the following example, there are a total of 3 potential false negatives. The table below shows the initial and final weights of these interactions.
Since we have removed 1 interaction from the network, we replaced it with the potential false negatives by, in our current work, inserting the top new interactions into the network. In our example, the top interaction in the above table belonged to the overall top interaction <Fus3,Ste5> and is thus added to the network. After 3 iterations of such false positive and false negative removals, we ended up with 14 interactions for the 14 proteins in our example, 3 of the original interactions were detected as false positives and hence removed from the repurified interactome, while 1 new interactions that were undetected by the Y2H screen were added to the final interactome. Our experimental evaluations reported in the manuscript showed biological evidence that the final interactome contains more high confidence interactions that the original interactome. |


All rights reserved.