Cohort Analysis for COVID-19
The therapeutic effect of drugs is a very interesting analysis in medical research. One example medication analysis is as follows:
Select the patients with COVID-19 as the main group. Divide this group by treatment locations (isolation ward or ICU). Find different recovering time among the patients in different age groups from taking a certain medication.
Here, we can explore the average healing time from taking medication to recovery among patients of different age groups. From these visualization results (Figure 1 and Figure 2), we could find that this kind of drug works well on the age 60-69 group.
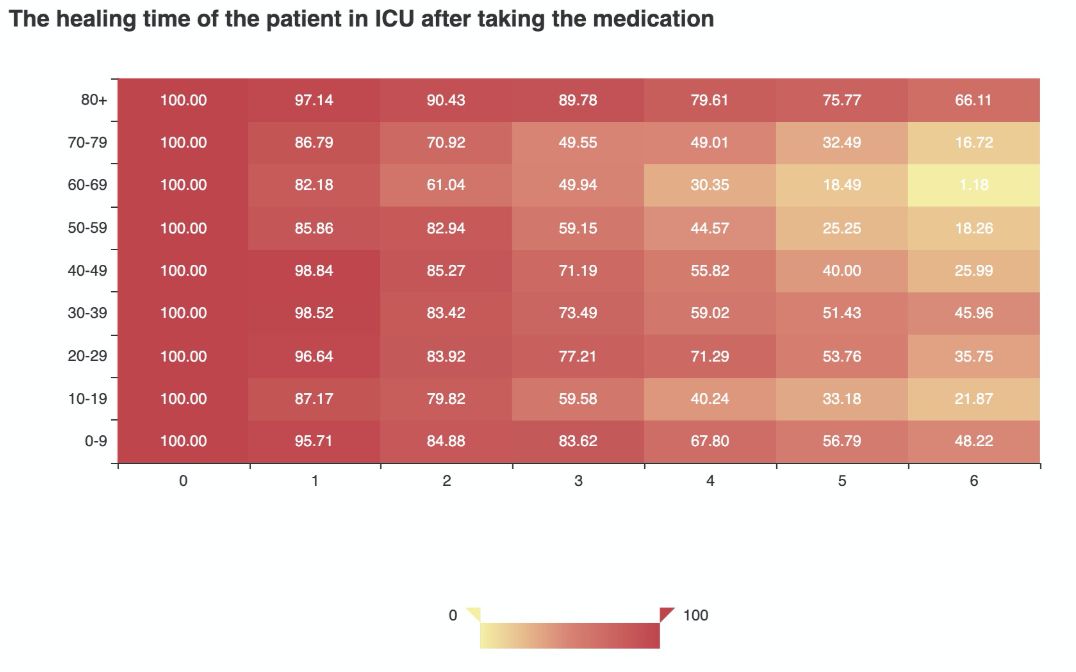
Figure 1: Heat map for the healing time of the patient in ICU after taking the medication
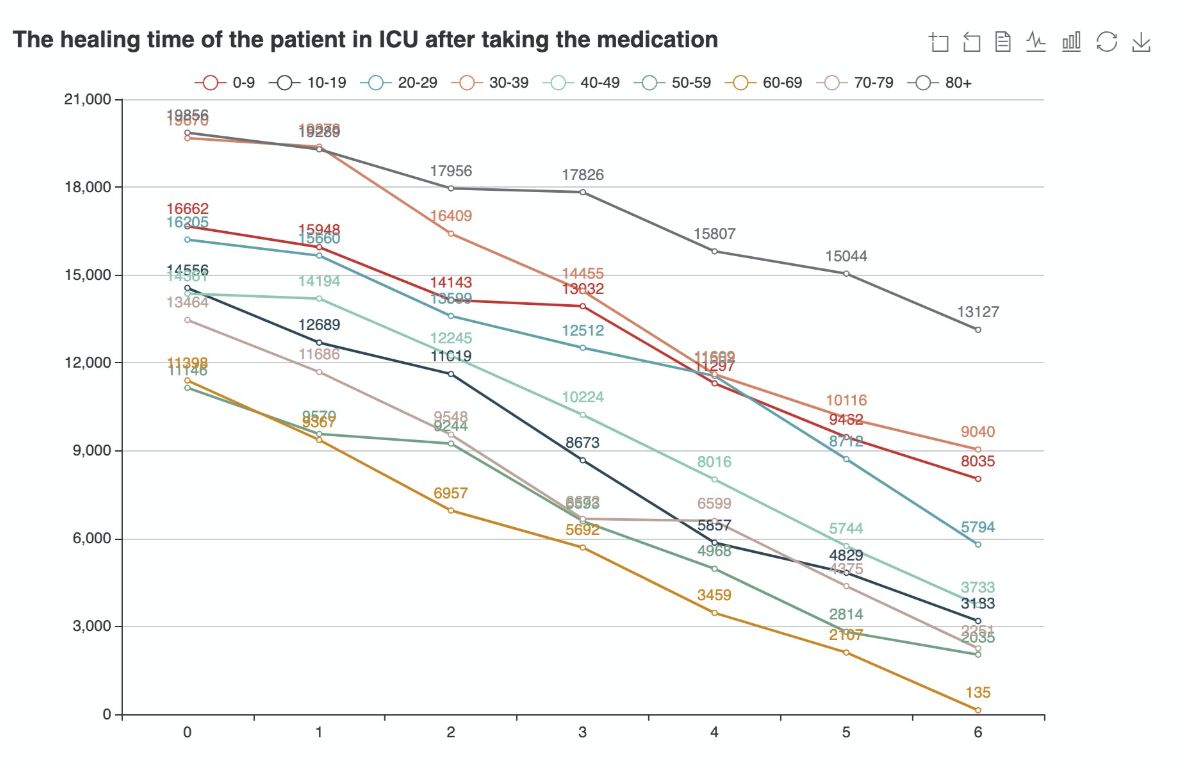
Figure 2: Line chart for the healing time of the patient in ICU after taking the medication
Besides, with COOL system, we could explore the risk factors in the COVID19 patients (time-series features such as vital signs, lab tests), and we could directly see the difference.
Here, we take the D-dimer as an example and explore the difference between the patients who are survival or not in the ICU.
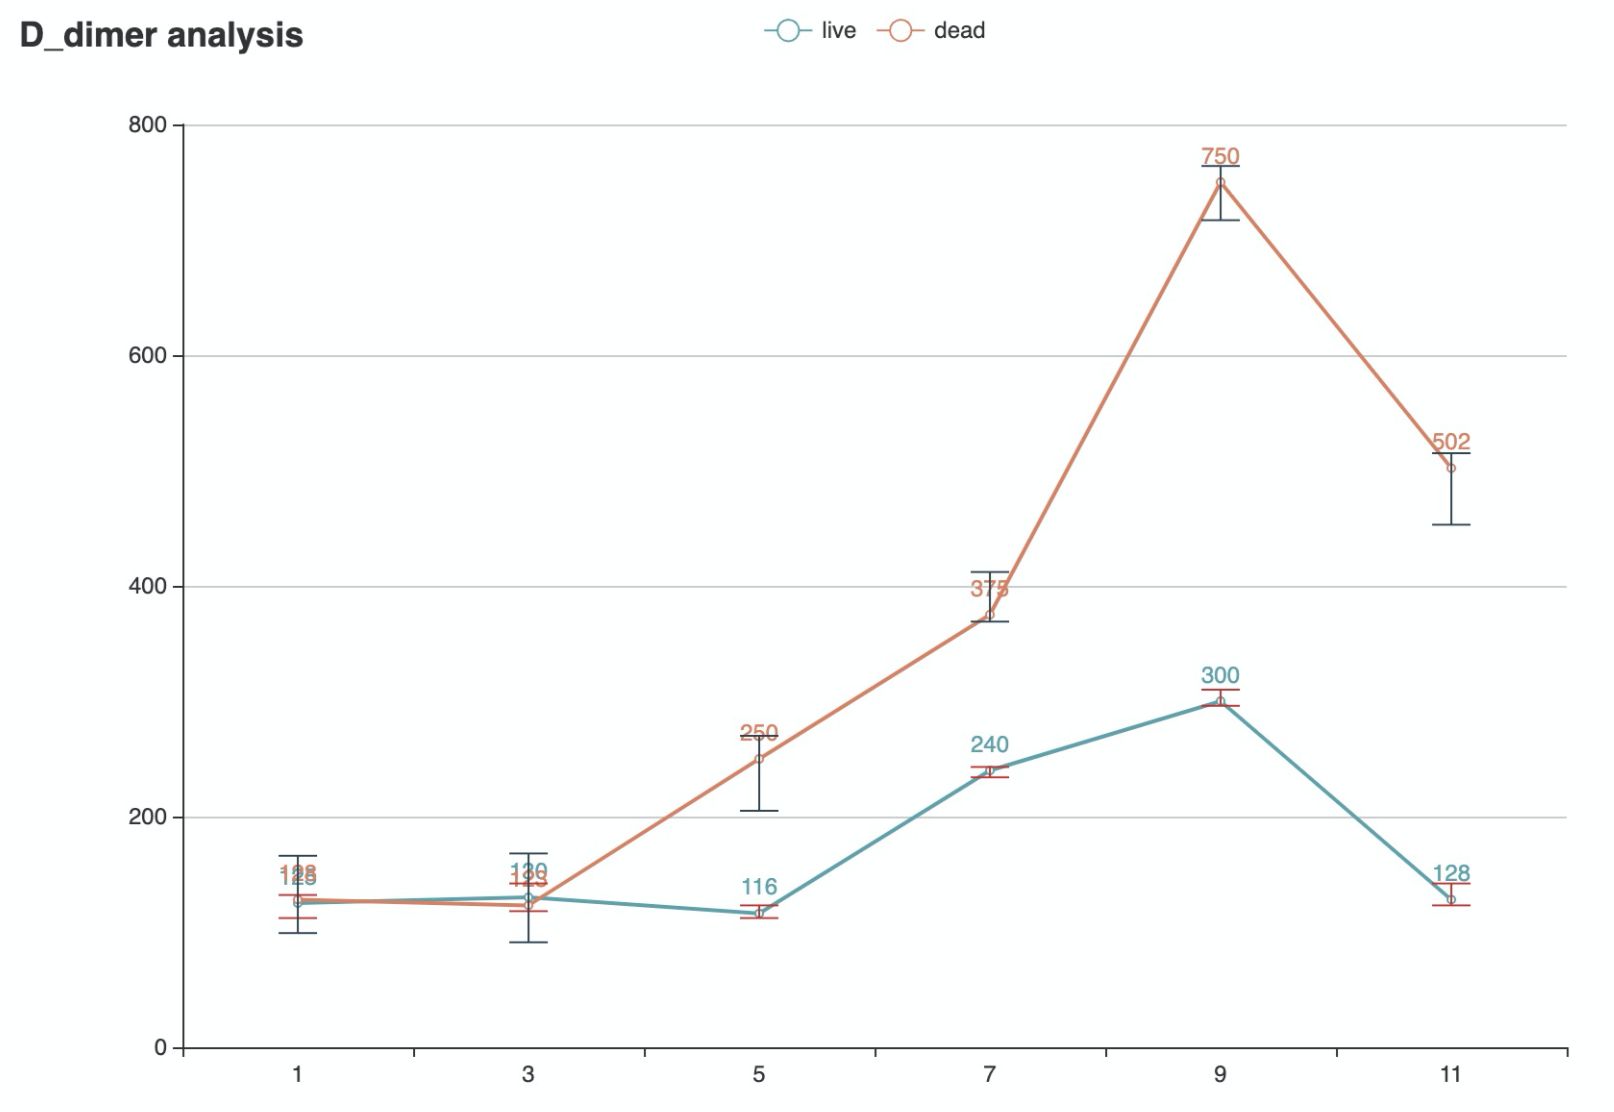
Figure 3: D_dimer Analysis
From Figure 3, we could find that the fluctuation of the vital sign (D dimer) among the survival patients is more stable than the patients who are not.