GEMINI Systems
We introduce some key systems and features in our GEMINI platform.
Data Cleaning and Integration
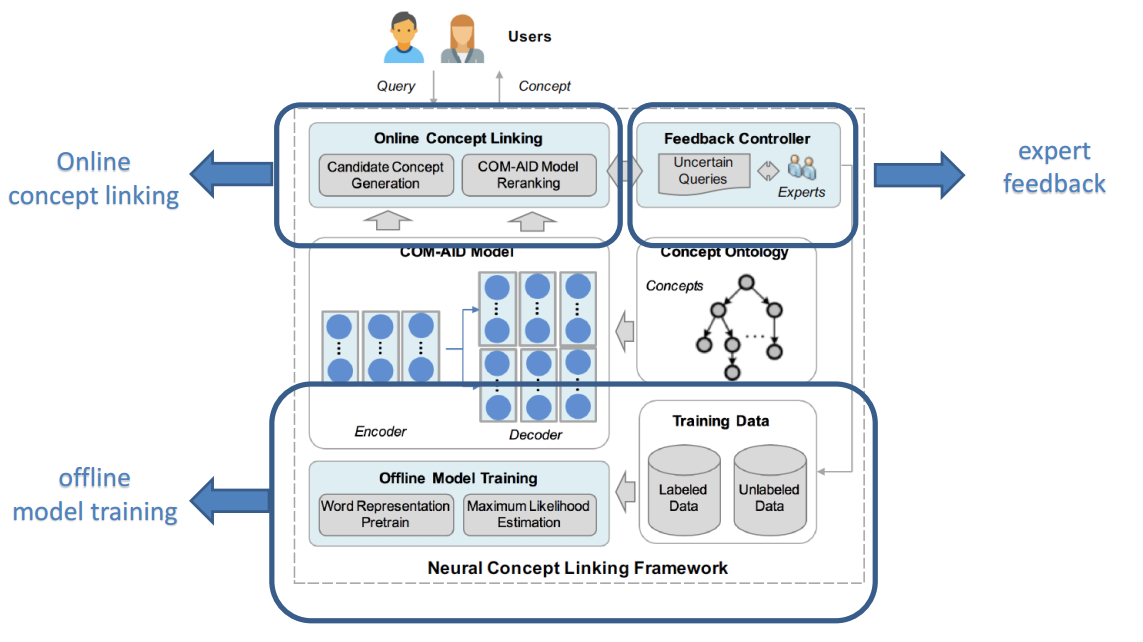
Figure 1: Overview of DICE
In EMR data, the diagnosis codes are always missing while the diagnosis descriptions exist. Consequently, we can fill in the missing diagnosis codes using the diagnosis descriptions. However, since the diagnosis descriptions are input manually by doctors, they are very messy, including abbreviations and mis-spellings. In order to fill in the missing diagnosis codes, we design and implement DICE, Data Integration and Cleaning Engine. Figure 1 shows the overview of DICE. It mainly consists of three components. Offline model training part is used to training the Deep Learning (DL) model for filling in missing diagnosis codes using knowledge base. Online concept linking is to fill in the missing diagnosis codes using the trained DL model. The expert feedback part is used to collect feedbacks from doctors for the wrongly filled-in diagnosis codes in order to improve the DL model.
Big Data Processing
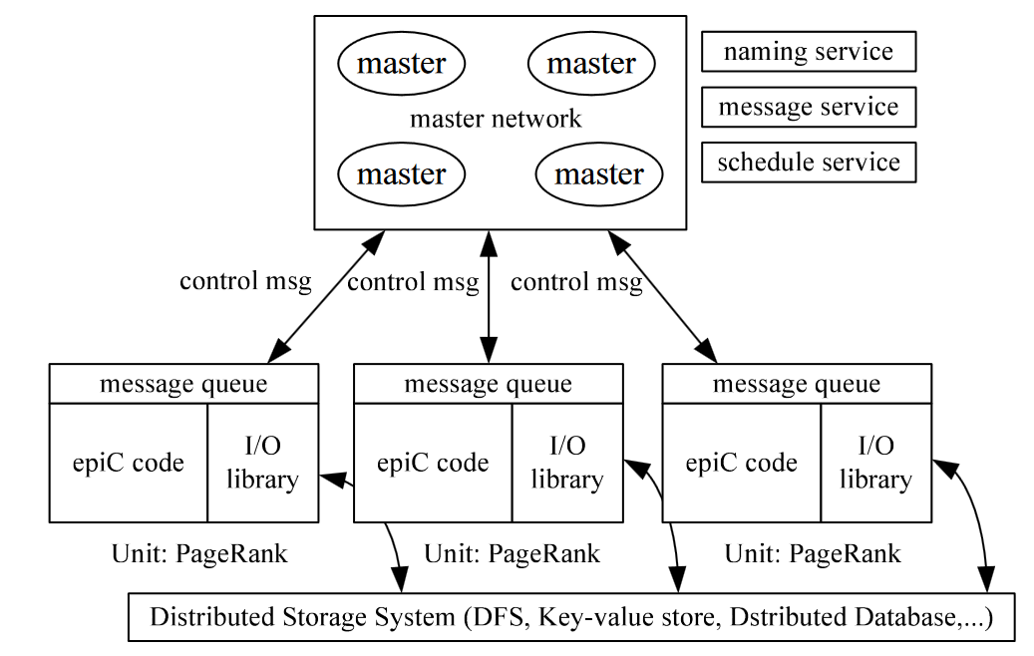
Figure 2: Overview of epiC
epiC is an Elastic, Power-aware, data-Intensive Cloud system. The objective is to design and implement an efficient multi-tenancy cloud system to support high throughout low latency transactions and high performance reliable query processing, with online analytic capability. In our GEMINI platform, epiC is used for extracting relevant patients and features.
Medical Concept Embedding with Time-Aware Attention
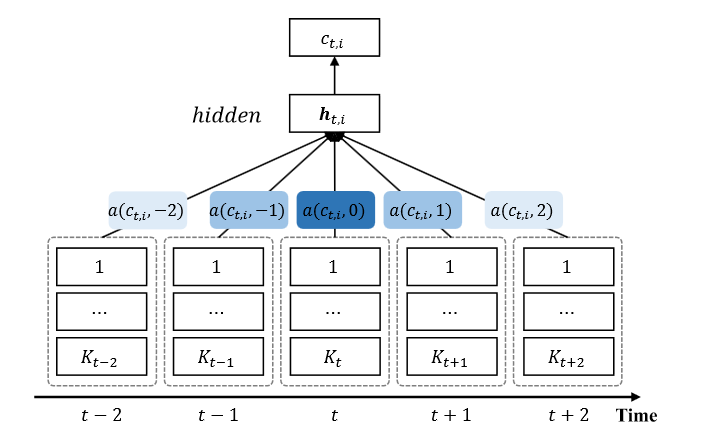
Figure 3: Medical concept embedding with time-aware attention
For EMR data, on one hand, the correlations between two medical concepts can be revealed by the time gap, on the other hand, the temporal scopes of medical concepts often vary greatly. Considering these temporal nature of EMR data, we design the medical concept embedding with time-aware attention. Figure 3 shows the proposed embedding. Its key idea is that based on the Continuous Bag-of-Words model, we employ the attention mechanism to learn a “soft” time-aware context window for each medical concept.
EMR Transformation
We design the EMR-T system to transform EMR data to the form that can be processed by machine learning/deep learning models. We introduce two innovative components in EMR-T: bias resolving imputation and medical feature embedding. The following sections will introduce them in detail.
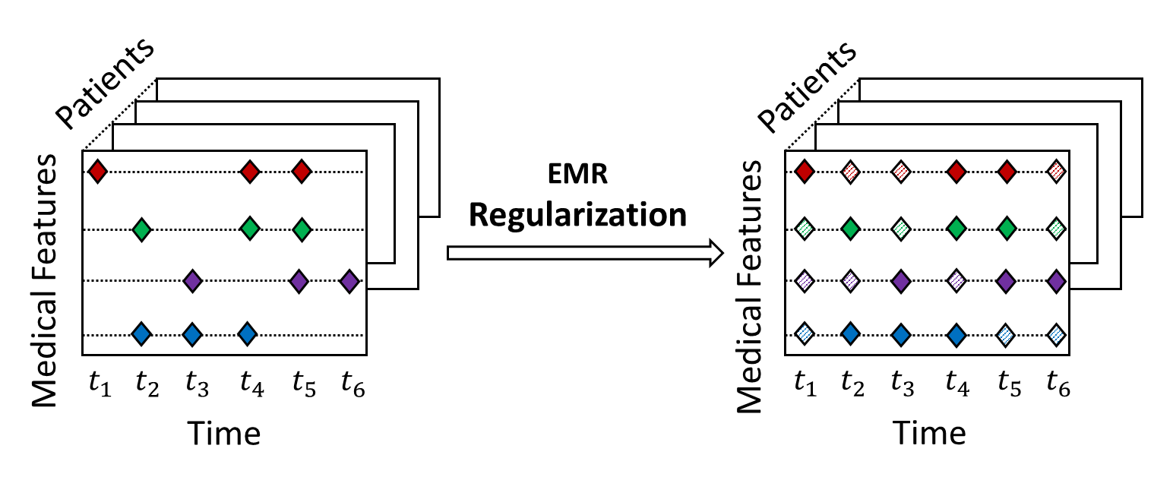
Figure 4: Bias resolving imputation
Bias resolving imputation is to transform the biased EMR series into unbiased EMR series.
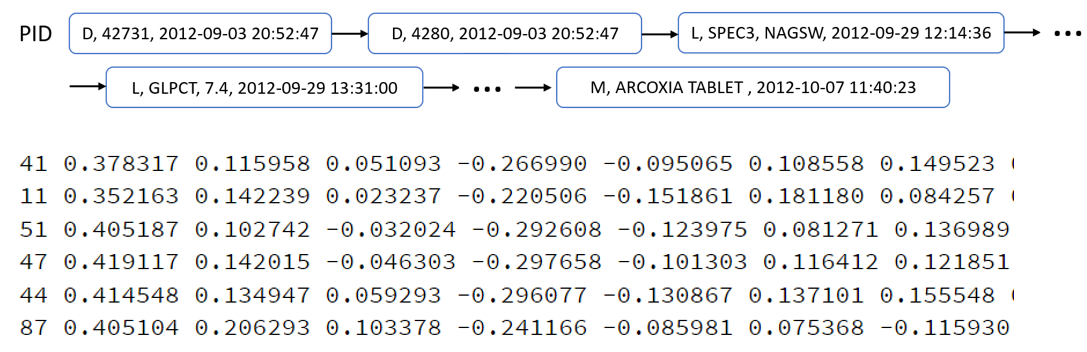
Figure 5: Medical feature embedding
Medical feature embedding is to convert raw medical features to continuous vectors.
Deep Analytics
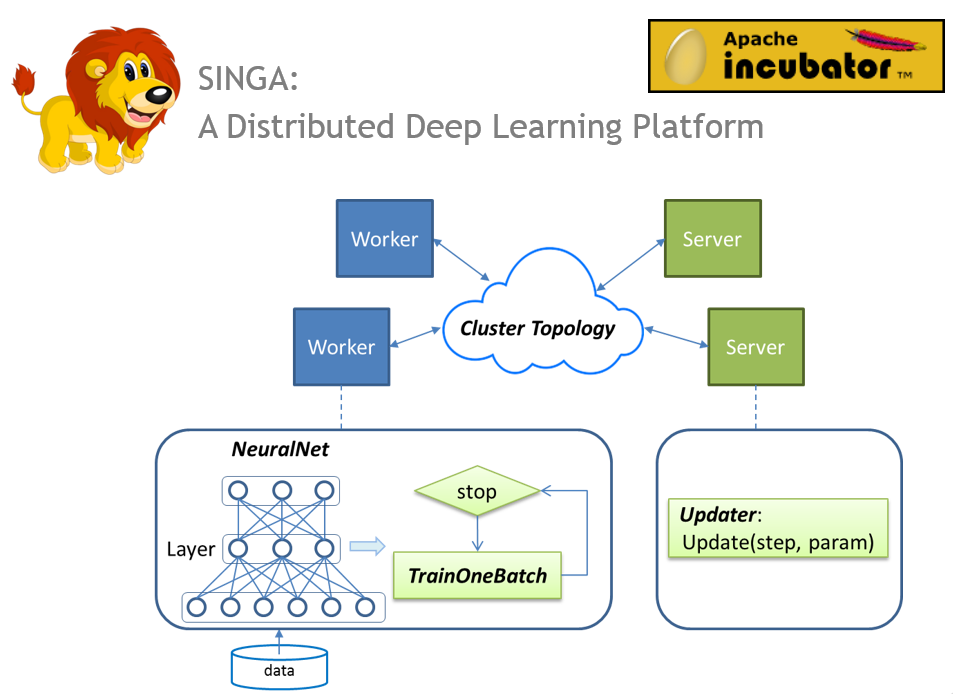
Figure 6: Distributed training of SINGA
Deep analytics is performed on a distributed deep learning platform, Apache SINGA, which is developed by our group. It has an intuitive programming model and good scalability. In the meantime, SINGA is extensible and able to support a wide range of applications involving different deep learning models.
In order to solve the noisiness problem existing in the healthcare data, we design an adaptive regularizer to better regularize the model. Figure 7 illustrates the idea of the adaptive regularizer.
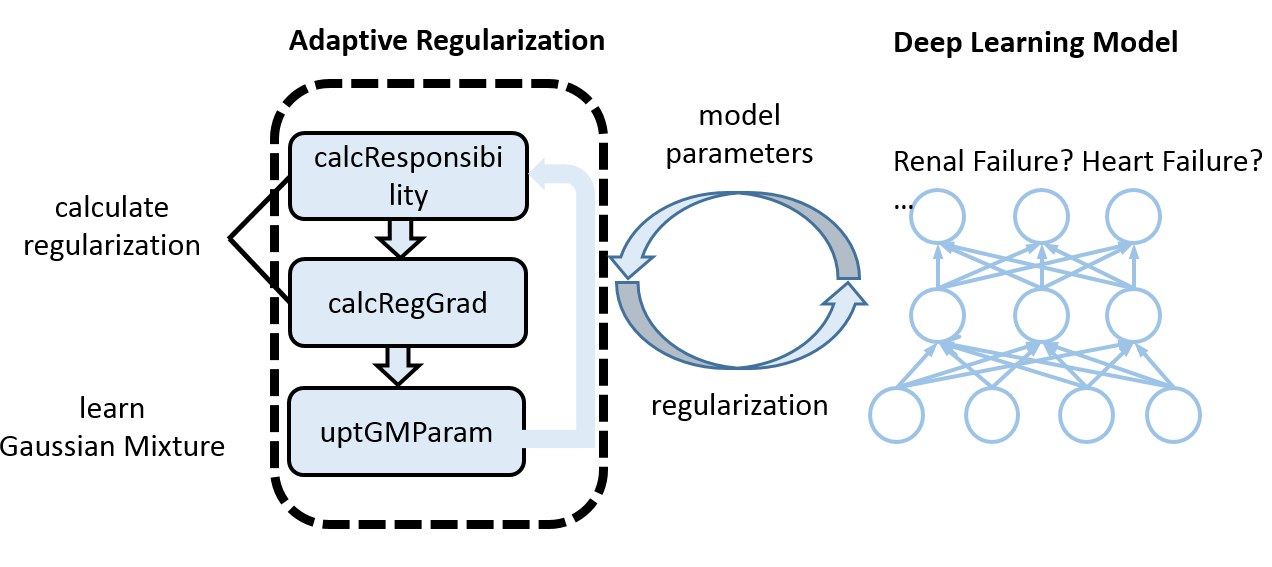
Figure 7: Adaptive regularizer
The key idea of adaptive regularizer is to adaptively learn a Gaussian Mixture regularization function that imposes different strengths of regularization to informative and less informative features respectively. Figure 7 shows the overview of adaptive regularizer. The deep learning model inputs model parameters to the adaptive regularization tool, the adaptive regularization tool will then learn regularization adaptively according to model parameters and impose different regularization strengths to different features.
Cohort Analysis
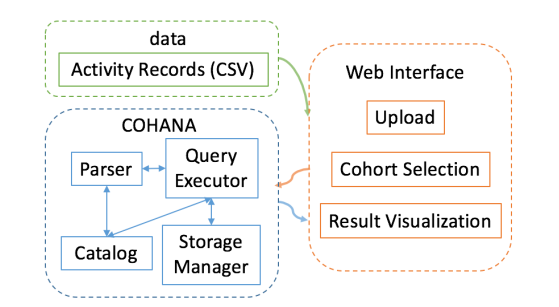
Figure 8: System architecture of COHANA
Cohort analysis, which aims to find user behavioral trends hidden in time series, is one of the most commonly used techniques. COHANA, our proposed query processing system, is designed for healthcare cohort analysis. Figure 8 shows the overall system architecture. The input of the system is the data in the green rectangle and there are two components of the system, i.e., the COHANA engine and the web interface, which are respectively surrounded by a blue and orange rectangle.The key part, COHANA engine, consists of a parser, a catalog, a query executor and a storage manager, wherein the last two components are the cores to support efficient cohort analysis queries.
Dataset Management
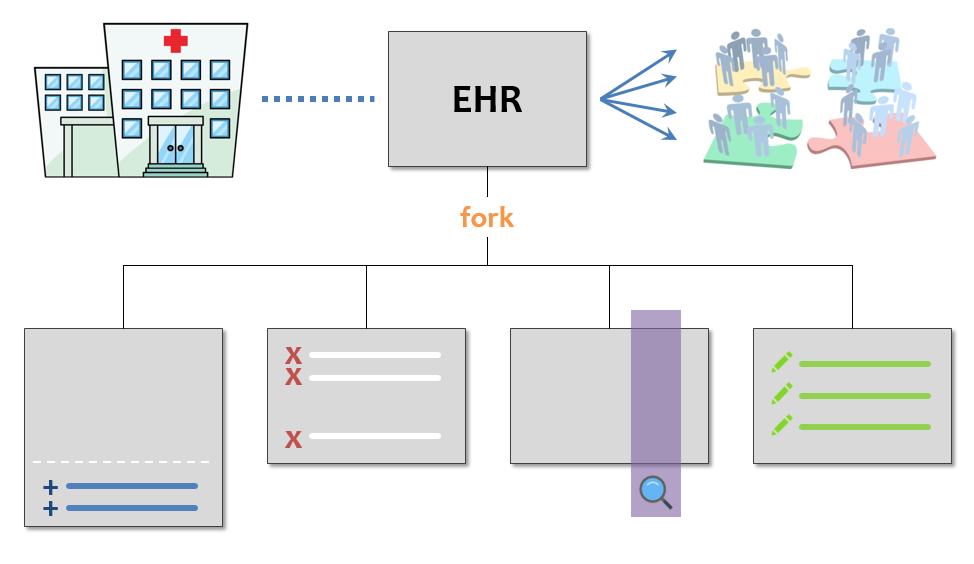
Figure 9: EHR data analytics using Forkbase
Different users may need to process the same data table, e.g., adding records, deleting records, querying records and editing records. With Forkbase, users do not need to worry about the underlying storage.
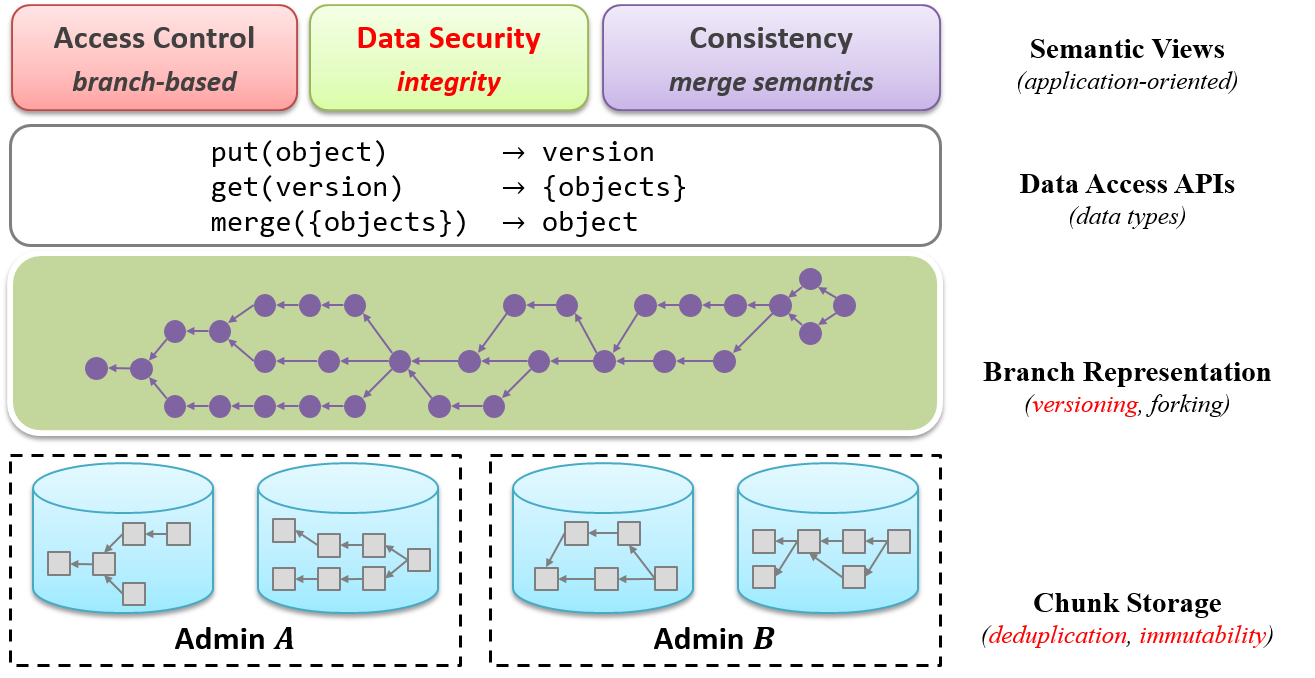
Figure 10: ForkBase application stack
When we deal with the underlying storage, we encounter challenges in terms of dataset cleansing, transformation, sharing and security. These challenges are also common in other healthcare datasets and applications. That is why we come up with ForkBase, a distributed data storage system which has rich semantics, to solve these challenges. Figure 10 shows the ForkBase application stack. It has core features like versioning, deduplication and immutability. For the data security part, we make use of blockchain.
Version Control Semantics
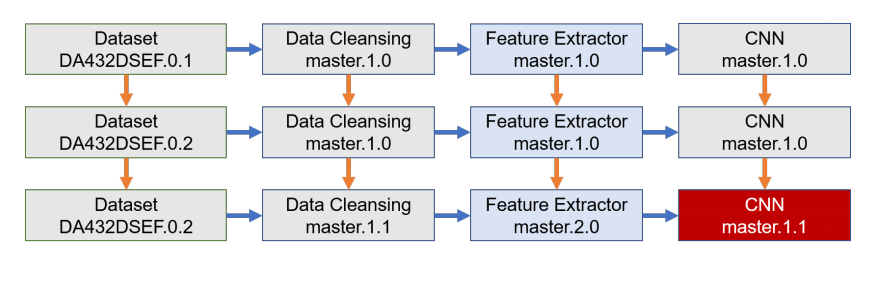
Figure 11: An example of the versioned GEMINI data analytics pipeline
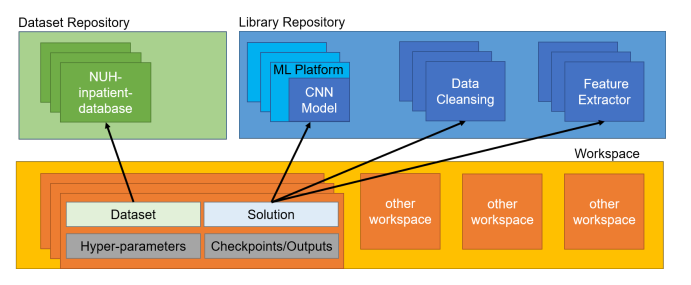
Figure 12: Architecture overview of GEMINI with version control semantics support
In order to address the different problems incurred by the evolution of datasets, preprocessing steps and analytics models, we introduce version control semantics to the GEMINI data analytics pipeline. Figure 11 shows an example of the versioned GEMINI data analytics pipeline. The key idea is to record the evolution of both the pipeline components and the pipeline’s directed acyclic graph (DAG), intermediate results and hyper-parameters. Figure 12 shows the architecture overview of GEMINI with version control semantics support, it includes dataset repository, library repository as well as workspace.