Disease Progression Modelling
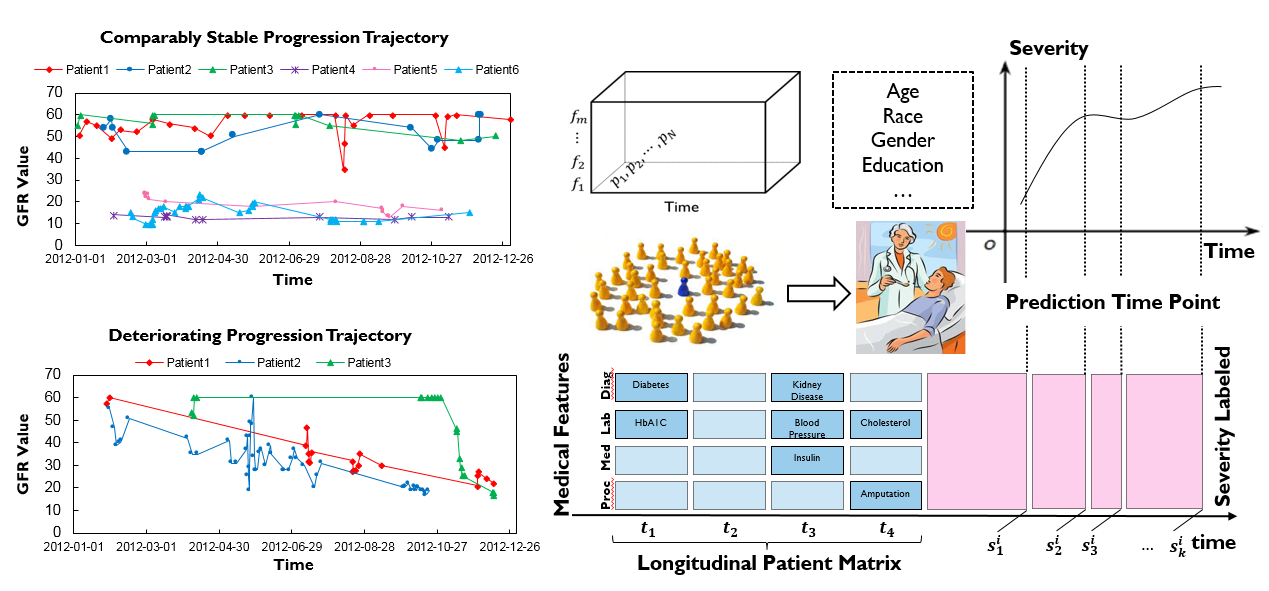
Figure 1: Disease progression modelling
In this disease progression modelling application, we choose the patients with chronic kidney disease as our cohort. The value of a lab test, GFR (short for Glomerular Filtration Rate) is used as the indicator for severity, and a lower GFR value indicates that the patient is more severe. From the progression trajectory of different patients, we can see that different patients have different progression trends. Some patients stay stable and others deteriorate fast. We use the patient history as input and predict the severity of patients in the future.
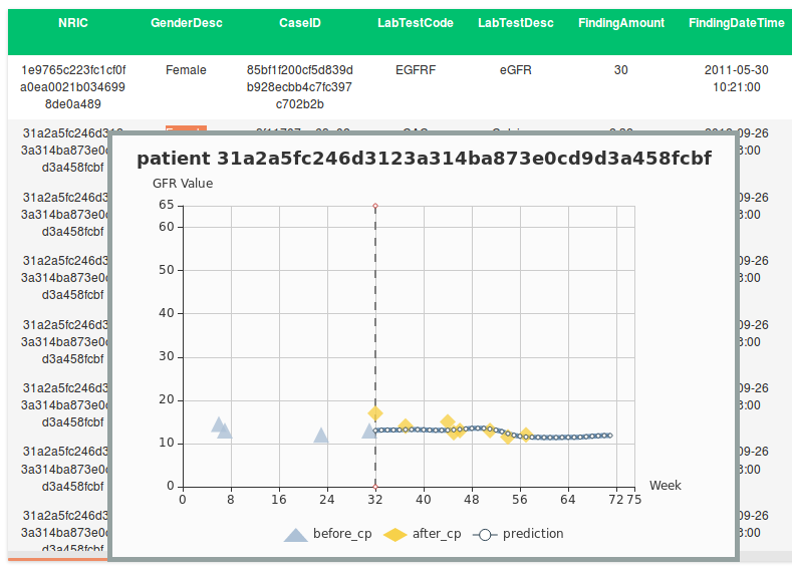
Figure 2: Disease progression modeling result
Our GEMINI platform gives the predicted trajectory of the patients in the blue curve and the ground truth is shown with the yellow dots. From the figure, we can see that our predicted trajectory is quite accurate, i.e., close to the ground truth.
For Disease Progression Modeling application, GEMINI now goes through the data of all patients in NUH diagnosed with CKD stage 3, 4 and 5 every day and provides predicted progression trajectories for each patient. With the predictions provided by GEMINI, personalized care recommendation is now able to be given to doctors. The current recommendations are as follows:
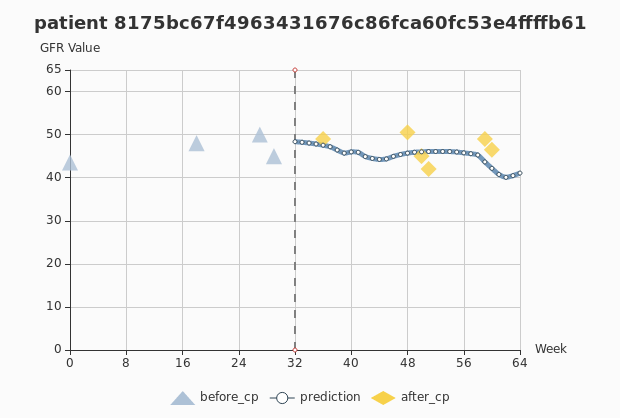
Figure 3
As shown in Figure 3, for patients who are predicted to be in a less severe stage of CKD, such as stage 1, 2 and 3, GEMINI recommends doctors to guarantee monitoring for these patients.
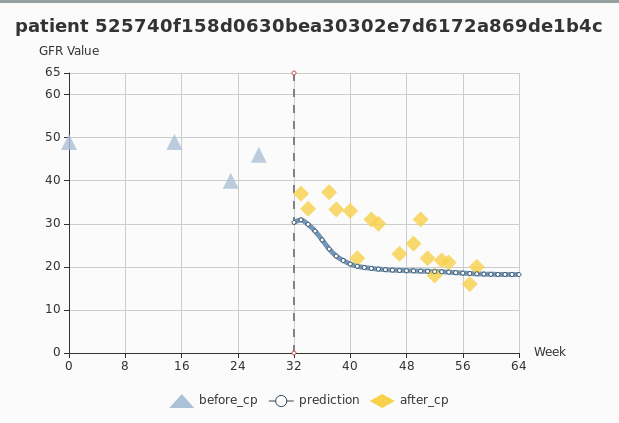
Figure 4
As shown in Figure 4, for patients who are predicted to have deterioration trends, GEMINI recommends doctors to take more aggressive interventions for these patients.
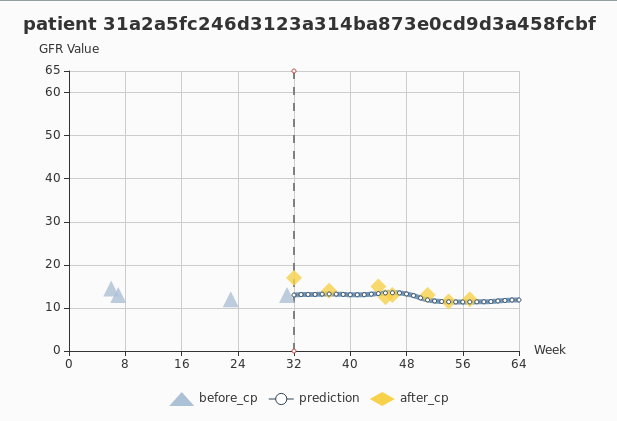
Figure 5
As shown in Figure 5, for patients who are predicted to be in the most severe stage of CKD stably, i.e., stage 5, GEMINI recommends doctors to take actions like dialysis or kidney transplant for these patients.