
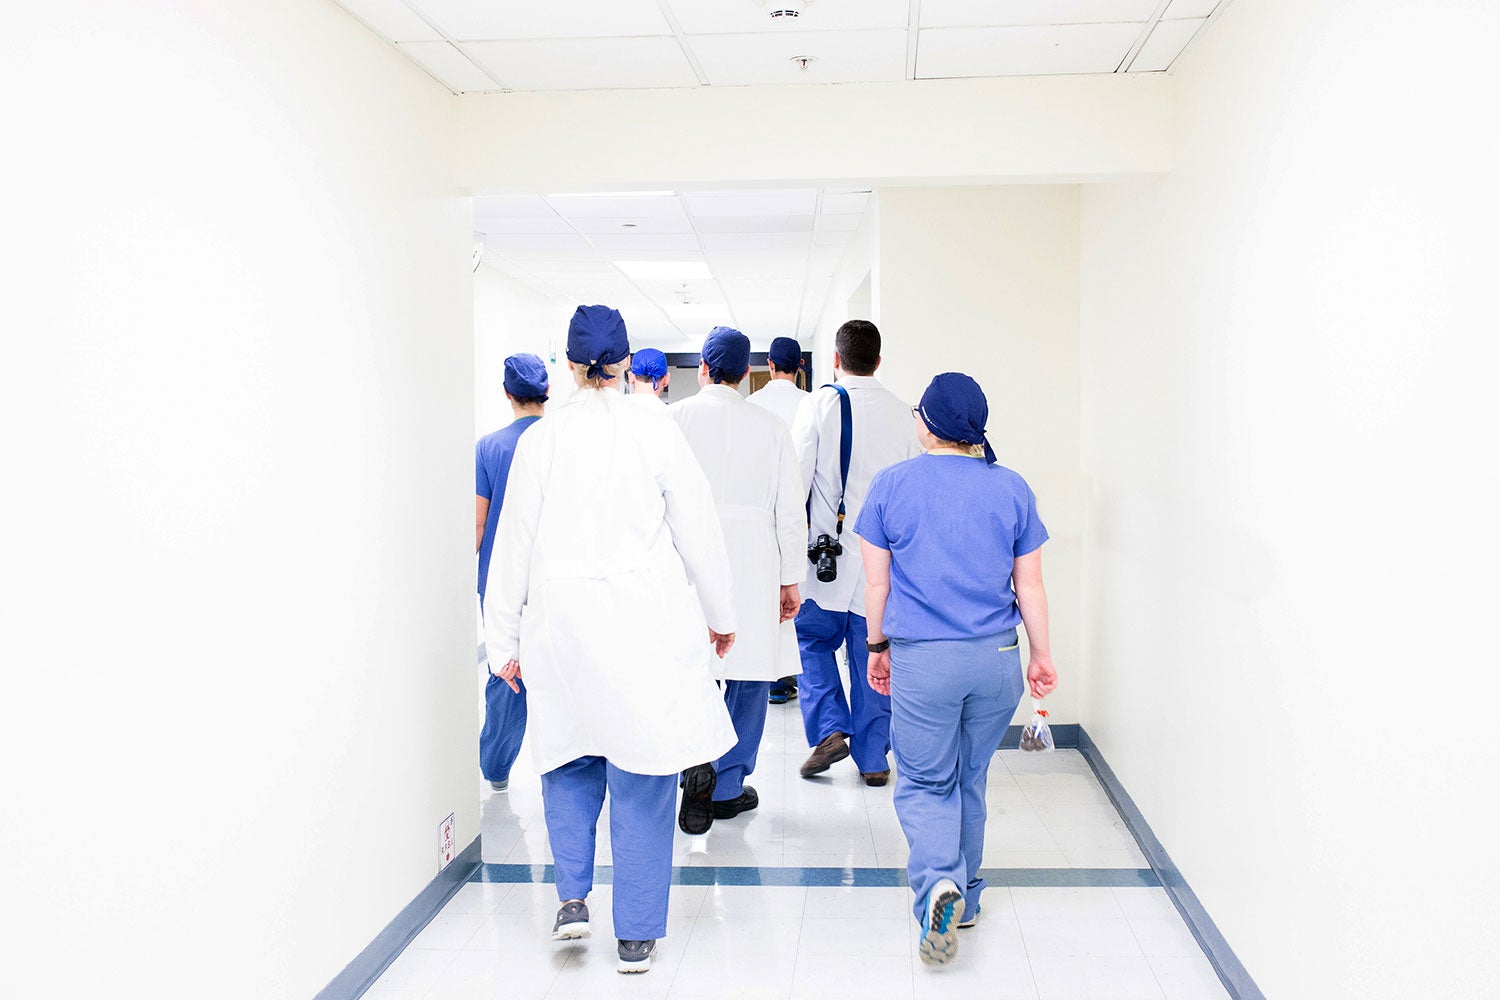
The intensive care unit where Dr. Jean-Daniel Chiche works in Paris is what you would expect from an ICU. Amidst an atmosphere of respectful quiet and hushed tones lie patients in isolated rooms, often tethered to a bewildering array of tubes, wires, monitors and machines.
Alongside a team of doctors and nurses, the blinking, sometimes beeping, apparatus monitor critically ill patients round-the-clock. Every day, they gather between 7,000 to 8,000 data points from each patient, revealed Dr. Chiche at a health conference in June.
ICU data — an array of radiology scans, nursing notes, medication orders, lab investigations, and other measurements — form a treasure trove of information. Physicians can use it to predict possible complications, improve patient outcomes, and deliver better care; while researchers can gain a deeper understanding of diseases to develop new treatments.
But the mass of information gathered can be overwhelming. “The central question is how do we take all this data and learn a clinically meaningful and succinct computational representation of the patient, which can then be used for exploratory or predictive analytics?” asks Vaibhav Rajan, an assistant professor from the NUS School of Computing who studies machine learning and algorithm design for healthcare applications.
Rajan runs the Clinical Data Analytics Lab at NUS, where he and his students are working to take disparate sources of data — genomic, physiological and social — and use these to model health information of individuals. But using such heterogeneous data is fraught with obstacles.
The first challenge is alluded to in the term itself. Heterogeneous data can involve numerous sources that come in varying formats. An ICU patient’s vital signs may be measured continuously or periodically in the form of numbers and waveforms. Nurses scribble on charts, taking note of a patient’s appearance and condition (e.g. How alert is he? How much did he eat for lunch? How much pain is he in?). Then there are lab tests, radiology images, drug prescriptions and so on.
“Each of these data sources is telling us something about the patient, but there may be correlated information as well as errors of various kinds during data processing,” says Rajan. For example, an inflammation visible in a CT scan might be related to elevated counts of a certain chemical as revealed in the blood test. Clinical notes may be full of inconsistently used medical abbreviations that can be difficult to process automatically and may introduce errors while learning patient representations.
“If we take all these different data sources and naively combine them, then the information about each patient may be too much for predictive algorithms” he says. This is especially true for image and text data, such as MRI scans and clinical notes. It’s a problem researchers call “the curse of dimensionality”.
“Moreover, without careful processing and removal of errors, subsequent analysis may give misleading results. So, we have to be able to combine them in a smart way so that errors and correlations are suitably recognised and handled to obtain the concise representations with which effective predictive models can be developed,” he says.
Integrating multiple sources of clinical data: predicting ICU complications
Rajan’s previous projects have demonstrated the value of such integration for predicting unforeseen ICU complications.
For example, his team invented a novel binary classification method to identify ICU patients at risk of experiencing an Acute Hypotensive Episode (AHE; when low blood pressure suddenly occurs and remains for a sustained period of time) using multiple vital signs. When tested on data from more than 4,500 patients, the classification method outperformed existing ones, identifying those at risk of AHE two hours in advance of onset with a 95 percent specificity and a sensitivity of close to 80 percent.
In another study, his team developed techniques to effectively preprocess clinical notes and combine them with other numerical clinical information. When applied to more than 700 patient records, this method successfully extracted discriminatory information from the notes, allowing physicians to identify patients at risk of postoperative acute respiratory failure up to days in advance with an overall accuracy of more than 80 percent.
Figuring it out with factorisation: from critical care to developing cancer drugs
While these previous studies had developed methods to integrate specific clinical data sources, Rajan and his team at the Clinical Data Analytics Lab are now developing more general factorisation-based techniques to integrate arbitrary collections of heterogeneous data for learning patient representations. These can be used in a wide variety of clinical applications.
Collective Matrix Factorisation (CMF) is one such technique that takes heterogeneous data in the form of matrices (which shows pairwise relational data between two entities, such as patients and genes) and analyses the relationships between them. This is done by factorising them to obtain low-dimensional representations. “Doing this gives you a concise representation of the entity you’re interested in, which makes it easier for predictive algorithms to handle.”
However, classical CMF is limited in the kinds of correlations it can model because clinical and genomic data may exhibit rather complex correlations. In order to enhance our ability to model such complexities, Rajan’s team has developed a neural version of CMF, a technique called Deep Collective Matrix Factorisation (DCMF), that leverages the strength of deep learning within the framework of CMF. His group was the first in the world to develop such a deep-learning architecture for CMF.
Numerous biological datasets contain information about the interaction among the same entities, such as similarity between genes in terms of their functions, or similarity between patients in terms of their disease progression. Recognising that CMF cannot be directly used with such data, Rajan’s team developed methods to transform data without distorting their information content, to make them amenable for analysis with CMF or DCMF.
With these methods, his team has improved our ability to effectively integrate heterogeneous sources of clinical data to obtain useful representations. The efficacy of these methods, over previous best methods, have been empirically demonstrated in predicting potential drug targets for cancer treatment, and in studying how certain genes are associated with various diseases.
Many research questions still remain open. For instance, clinical data can be at different temporal resolutions, with measurement frequency ranging from a few times during a hospital episode (such as for lab investigations) to continuous recordings like ECG. Effectively integrating such data remains a challenge. Another uphill task is finding complex dependency patterns across multiple sources of information that may yield insights on novel clinical associations. Rajan and his team are currently working on these and other related problems.
All over the world, in hospitals, labs as well as in our smartphones, we are collecting large amounts of data that can inform us about our health. This presents an unprecedented opportunity to study and gain a deeper understanding of diseases, develop new treatments and improve healthcare ecosystems. Rajan and his team aspire to develop effective computational techniques that can seamlessly integrate such multiple heterogeneous sources of information to sieve out the most useful elements required for a clinical application.
He says: “We are drowning in a deluge of data and we believe that our ability to use and make sense of this data for clinical applications will crucially depend on such algorithms.”
Paper:
A dual boundary classifier for predicting acute hypotensive episodes in critical care