
From Haze to a Playable Campus: Inside Planet Out Loud
A Year 2 NUS Computer Engineering student built a 3D campus with air-quality readings, climate games and a tiny racing shuttle to test a new way of making climate change harder to ignore.
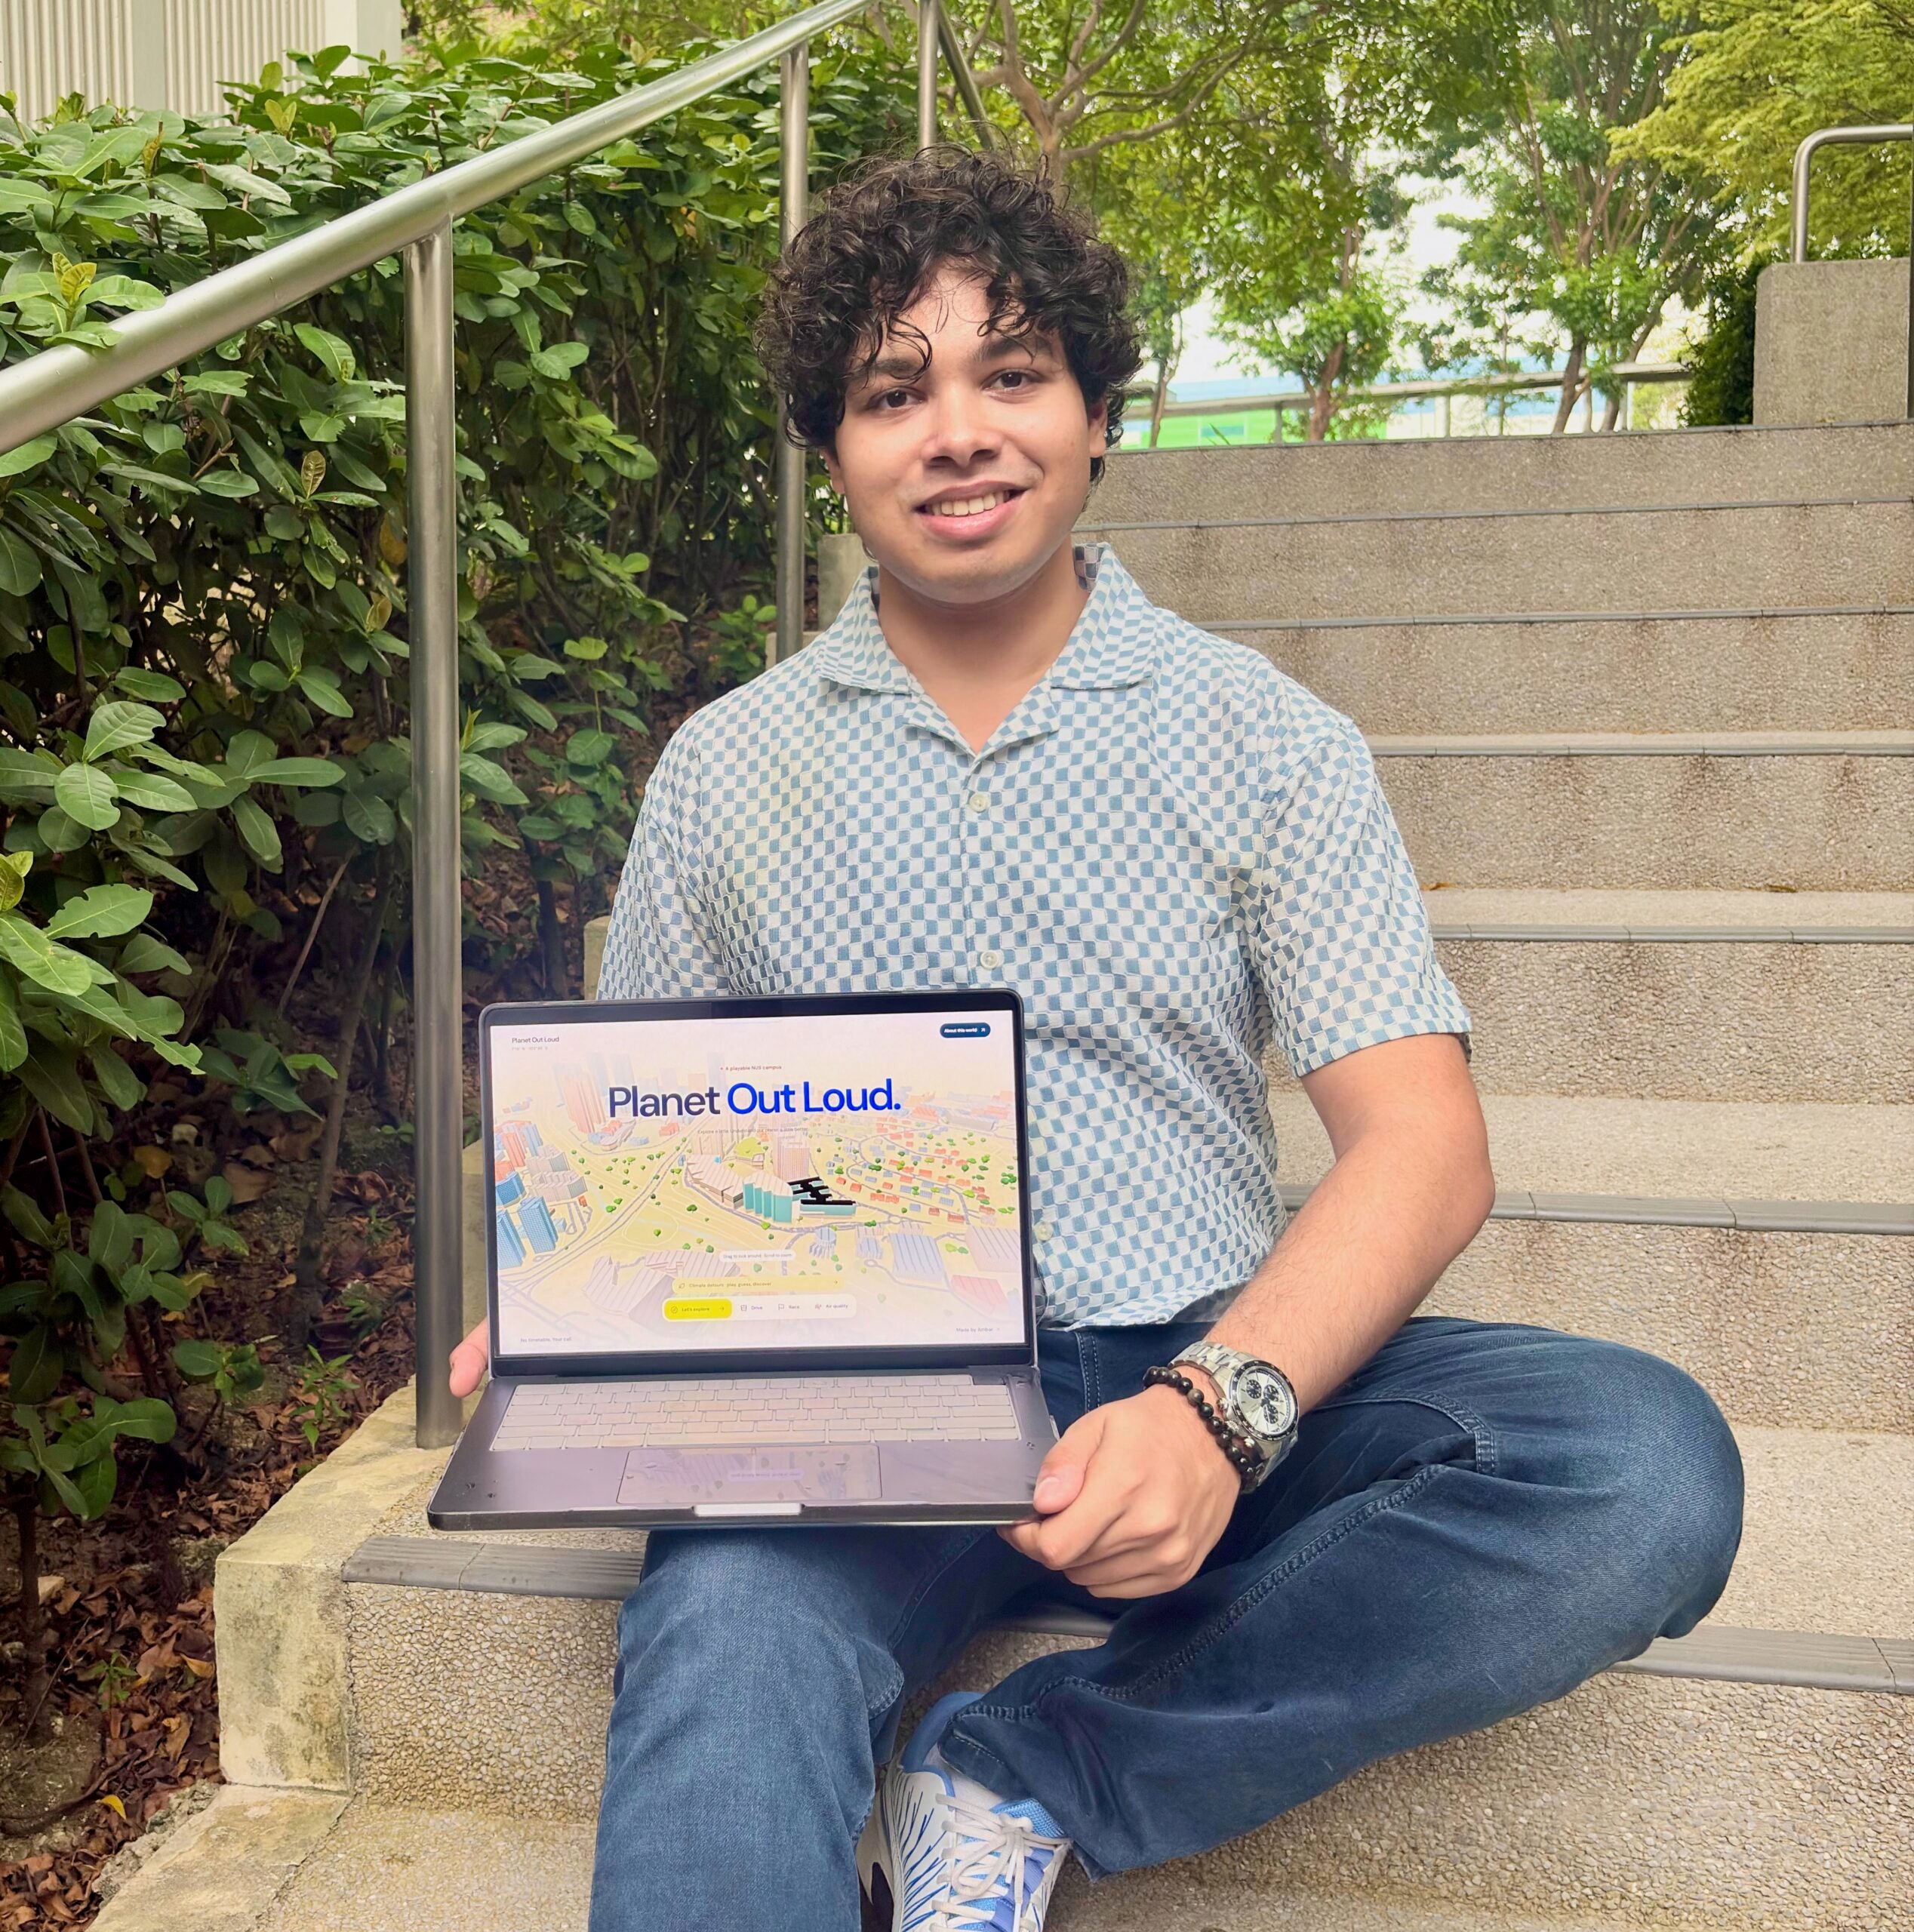
On 14 September, Ambar’s residential college sent an advisory saying the PSI had crossed 100.
The Year 2 Computer Engineering student, who has a second major in Mathematics and a minor in Physics, had wondered about the air for weeks. Back from a summer programme at Exeter College, Oxford, he had texted a friend to ask whether Singapore seemed hazier than usual. His friend said it felt normal.
“We were breathing the same air while inhabiting two different environments,” Ambar says. “People were not necessarily short of climate facts. The more difficult gap is between knowing something and learning to notice how it enters ordinary life.”
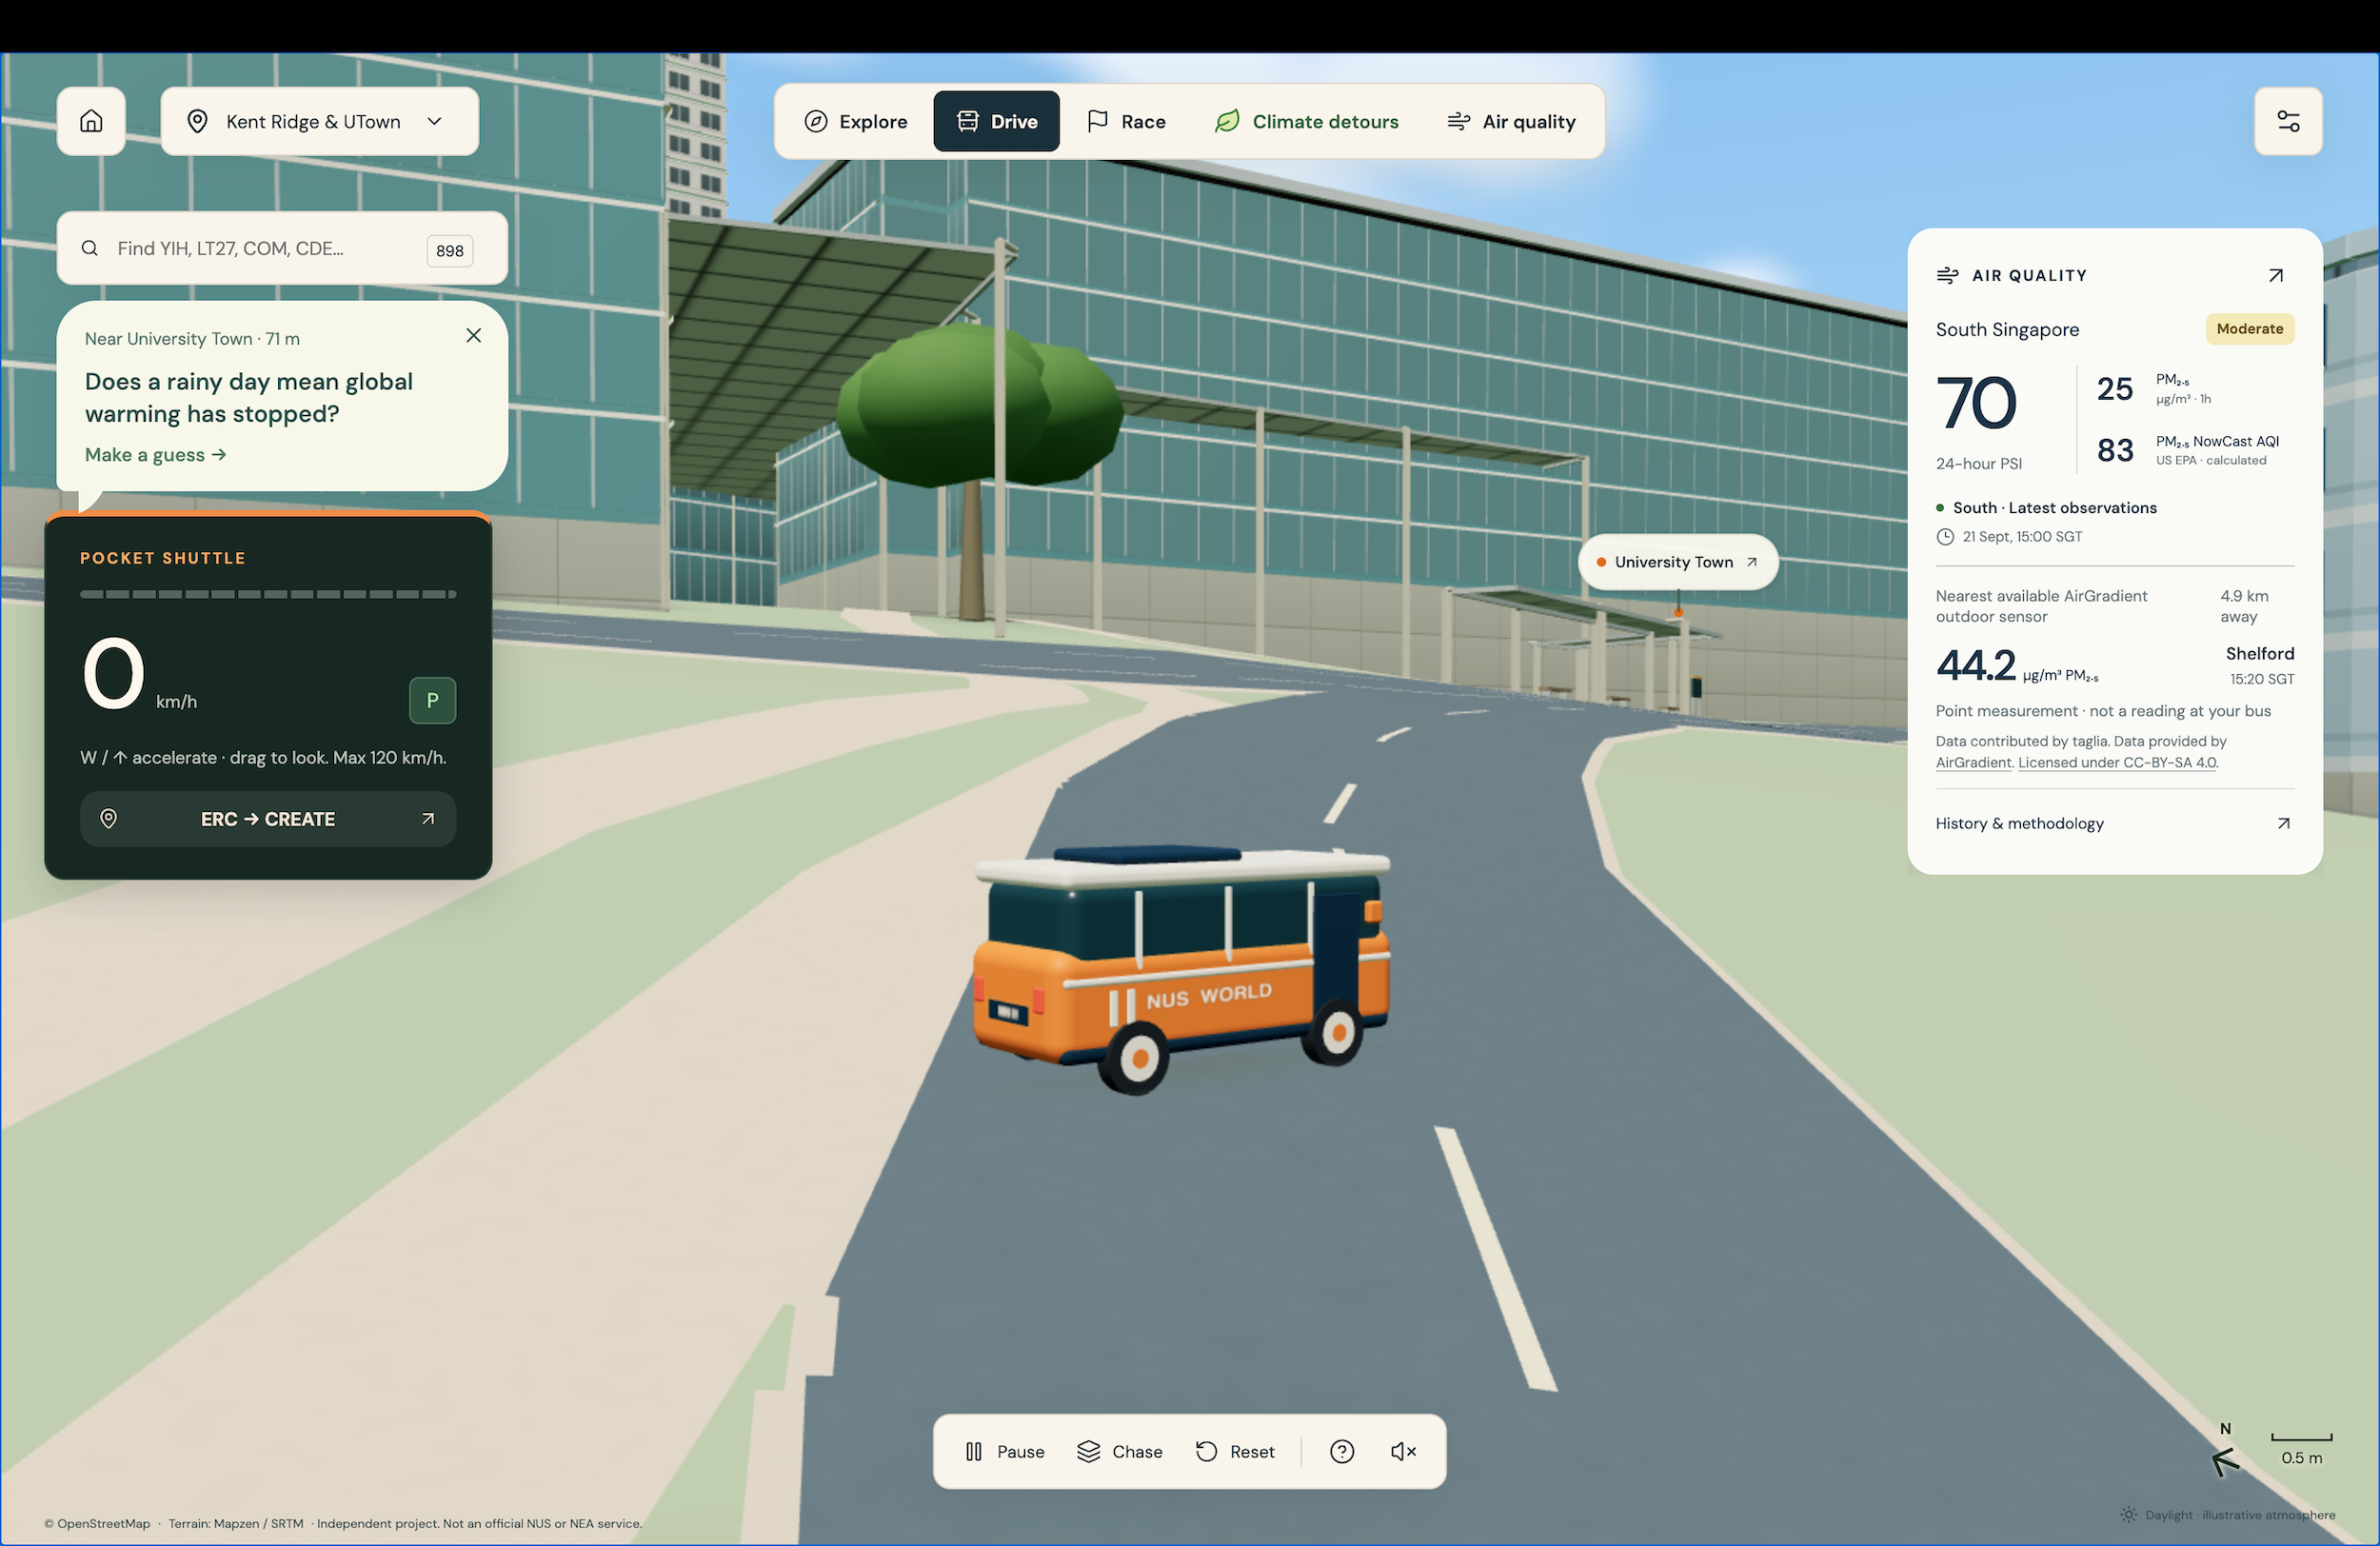
He started building a panel that would pull the official readings and nearby sensor data into one place. On the afternoon of 17 September, his air-quality panel showed three figures. The 24-hour PSI for the south of Singapore, from NEA data published on data.gov.sg, was 66. The nearest public AirGradient sensor, at Shelford, read 81.3 µg/m³ of PM2.5. The AQI he calculates from hourly readings, using the US EPA’s NowCast method, was 132.
“At first, I kept thinking, ‘One of these must be wrong,'” he says. “Eventually, I realised they were answering different questions.”
Most people, he says, arrive at a site like this wondering: “What is the air like around me, and what does this number actually mean?”
The PSI is a regional average over a day. The sensor is one point, measured minutes ago. The AQI follows a different country’s scale. He kept all three on the panel, each labelled with its source, time and scope, and added a note that a single sensor reading cannot produce a valid PSI. When a feed goes down, the panel says so.
He used an AI coding tool for parts of the build, testing and rewriting what it produced. At one point he wanted the reading to change as you moved around campus. The data couldn’t support street-by-street variation, so he left it out.
“I kept the number still.”
Starting with NUS
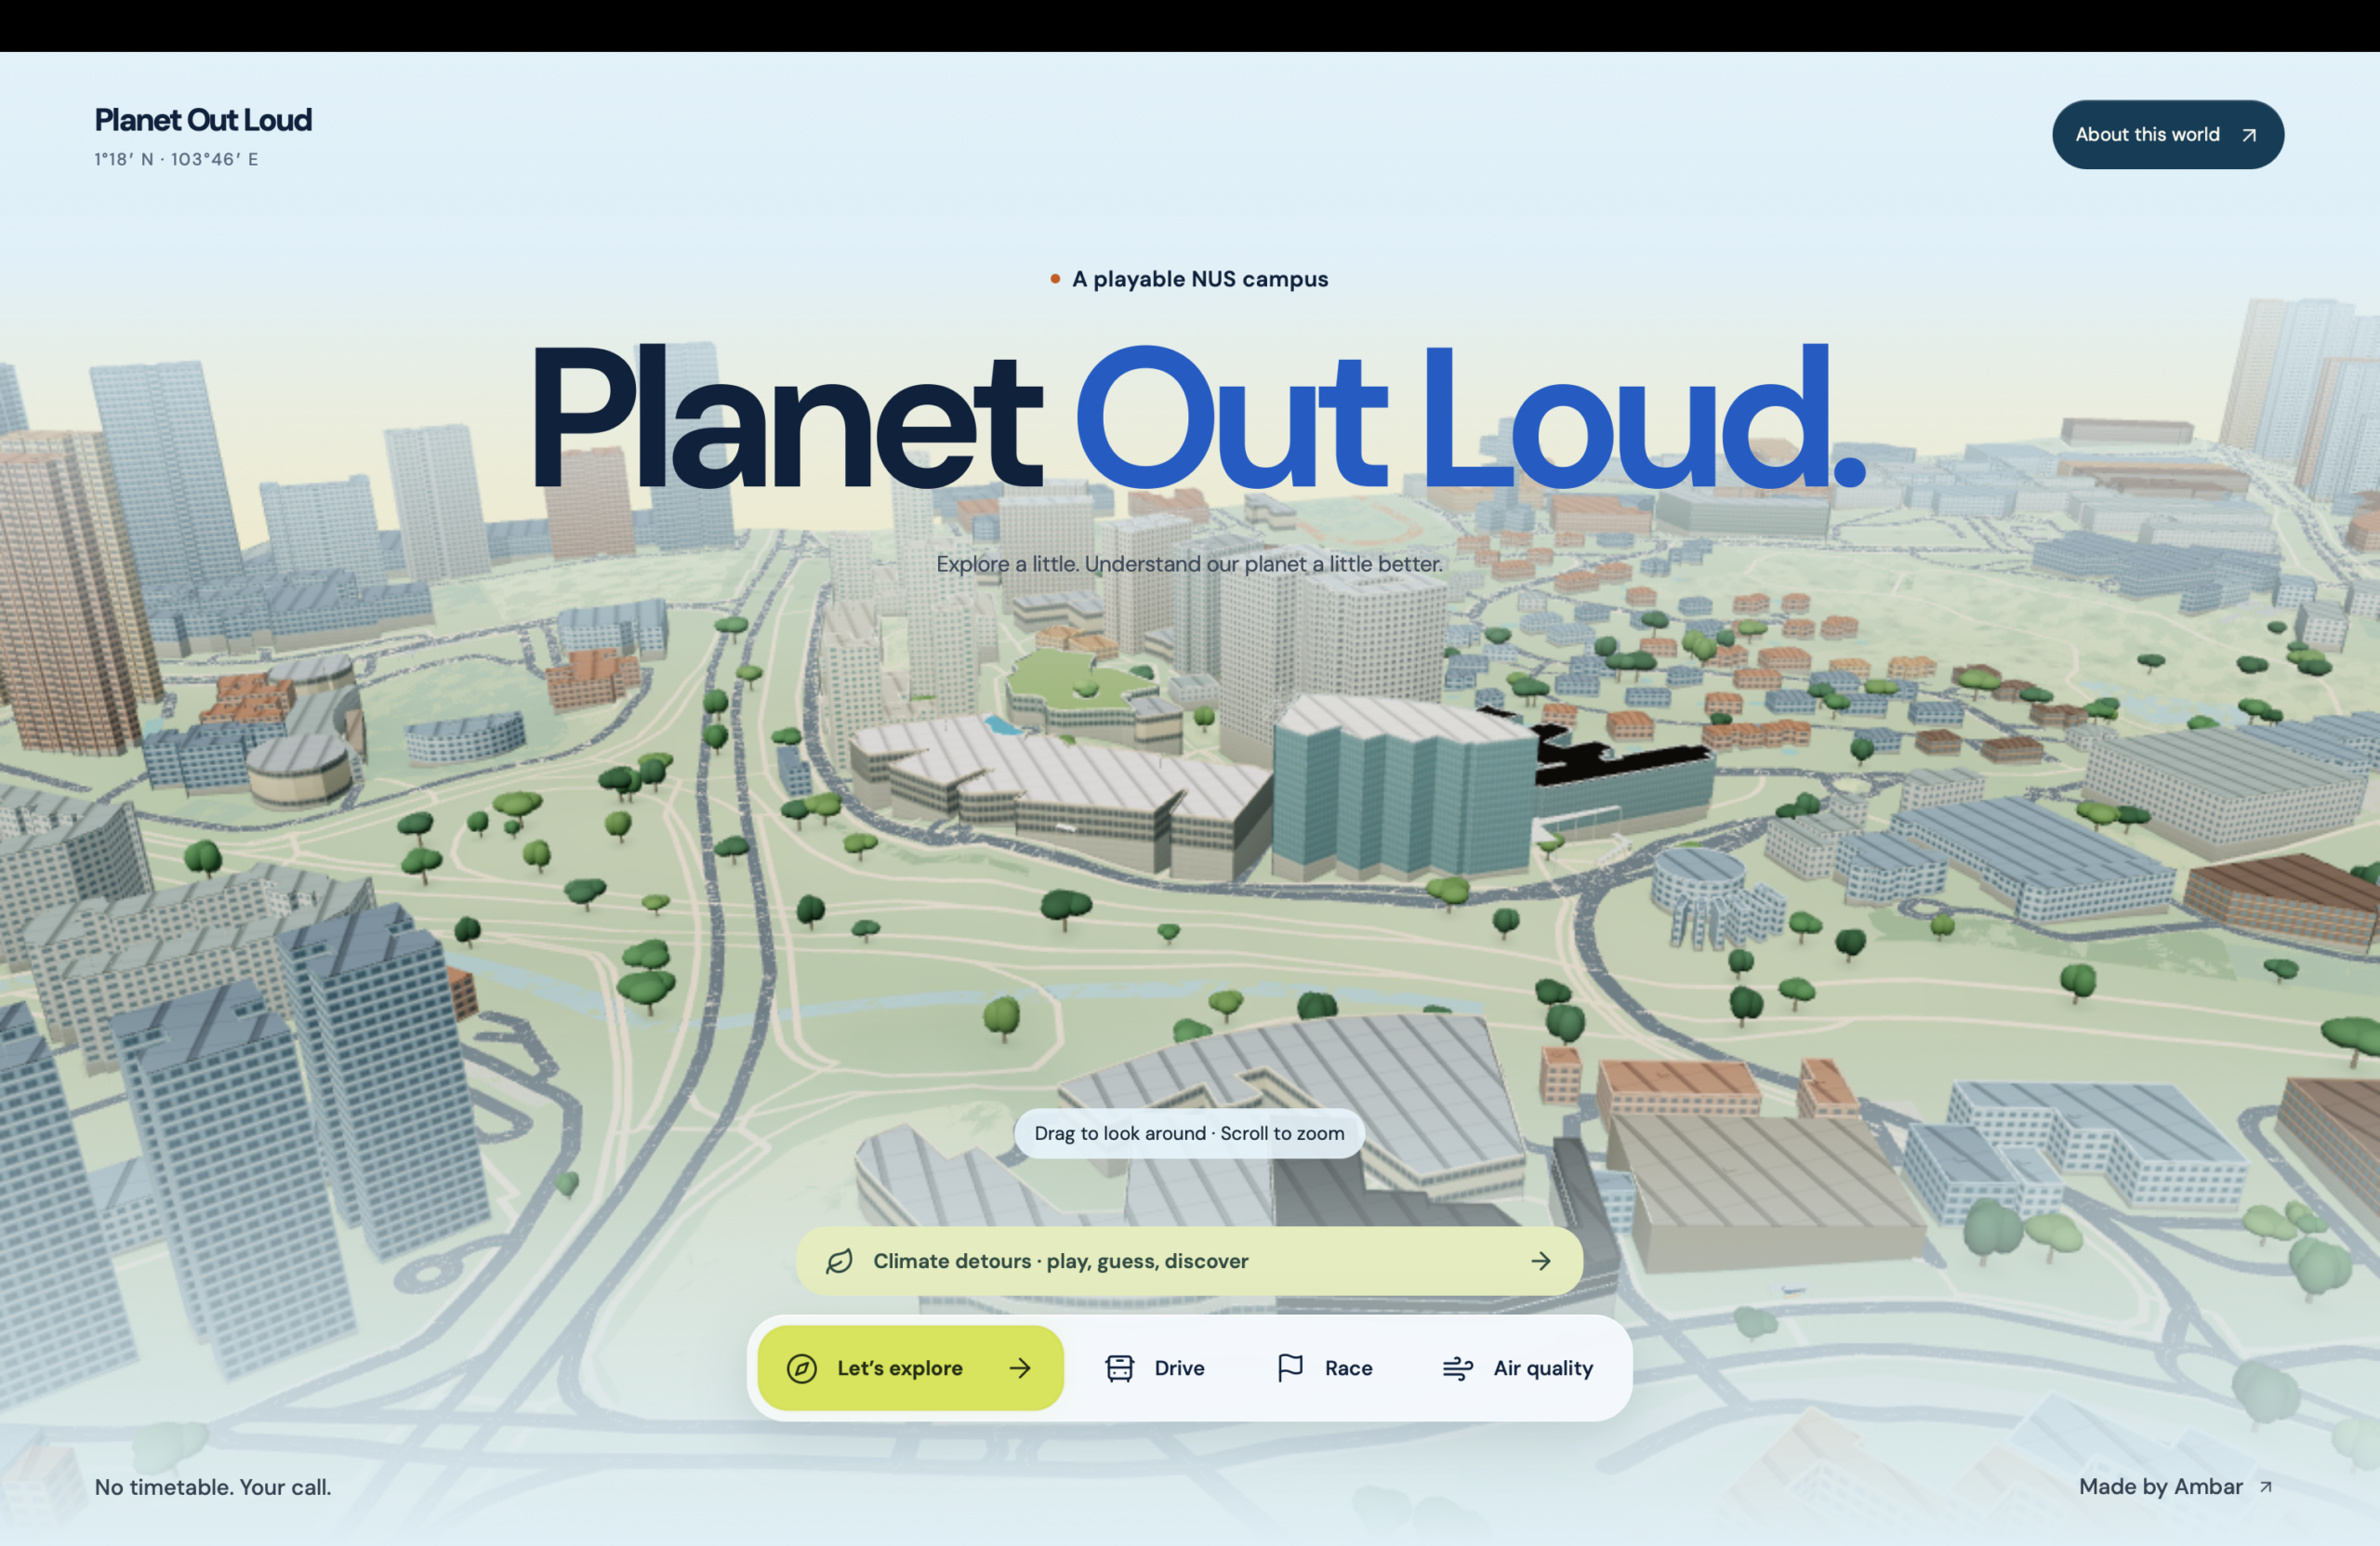
The panel sits inside Planet Our Loud, a 3D NUS campus, uilt in Three.js, that you can drive around in tiny shuttle. Buildings are generated from OpenStreetMap footprints. A footprint shows where a buidling stands, but not what makes it recognisable, so landmarks such as Central Library, Yusof Ishak House (YIH), the Education Resource Centre (ERC) and CREATE were adjusted by hand using photographs and architectural references.
He hasn’t shared the site publicly, but around 200 people have found it, he says. Among the few friends he later shared it with, feedback came quickly and in remarkable detail. YIH was missing, one building was floating, and there was barely room to drive between ERC and CREATE. He has since fixed most of it.
Park near a bus stop and a climate question appears.
At Oxford University’s Exeter College Summer Programme, Ambar took a course on anthropology and climate change with Professor Ann Kelly and Quantum Computer Science with Professor Andrew Steane. Professor Kelly’s class often discussed the environment close at hand: the air outside your room, the bus stop where you wait. He started with NUS because “it was a place I knew, and the haze had become part of an ordinary conversation there.”
Neither anthropology nor climate change appears in the title of his degree. “That is something NUS has taught me,” he says. “There are too many interesting things in the world for curiosity to stop at the edge of a major.”
Climate detours
The games follow the same rule as the panel. “If the world supplied the number, it would show its receipt,” Ambar says. “If I supplied the movement, I would admit it.”
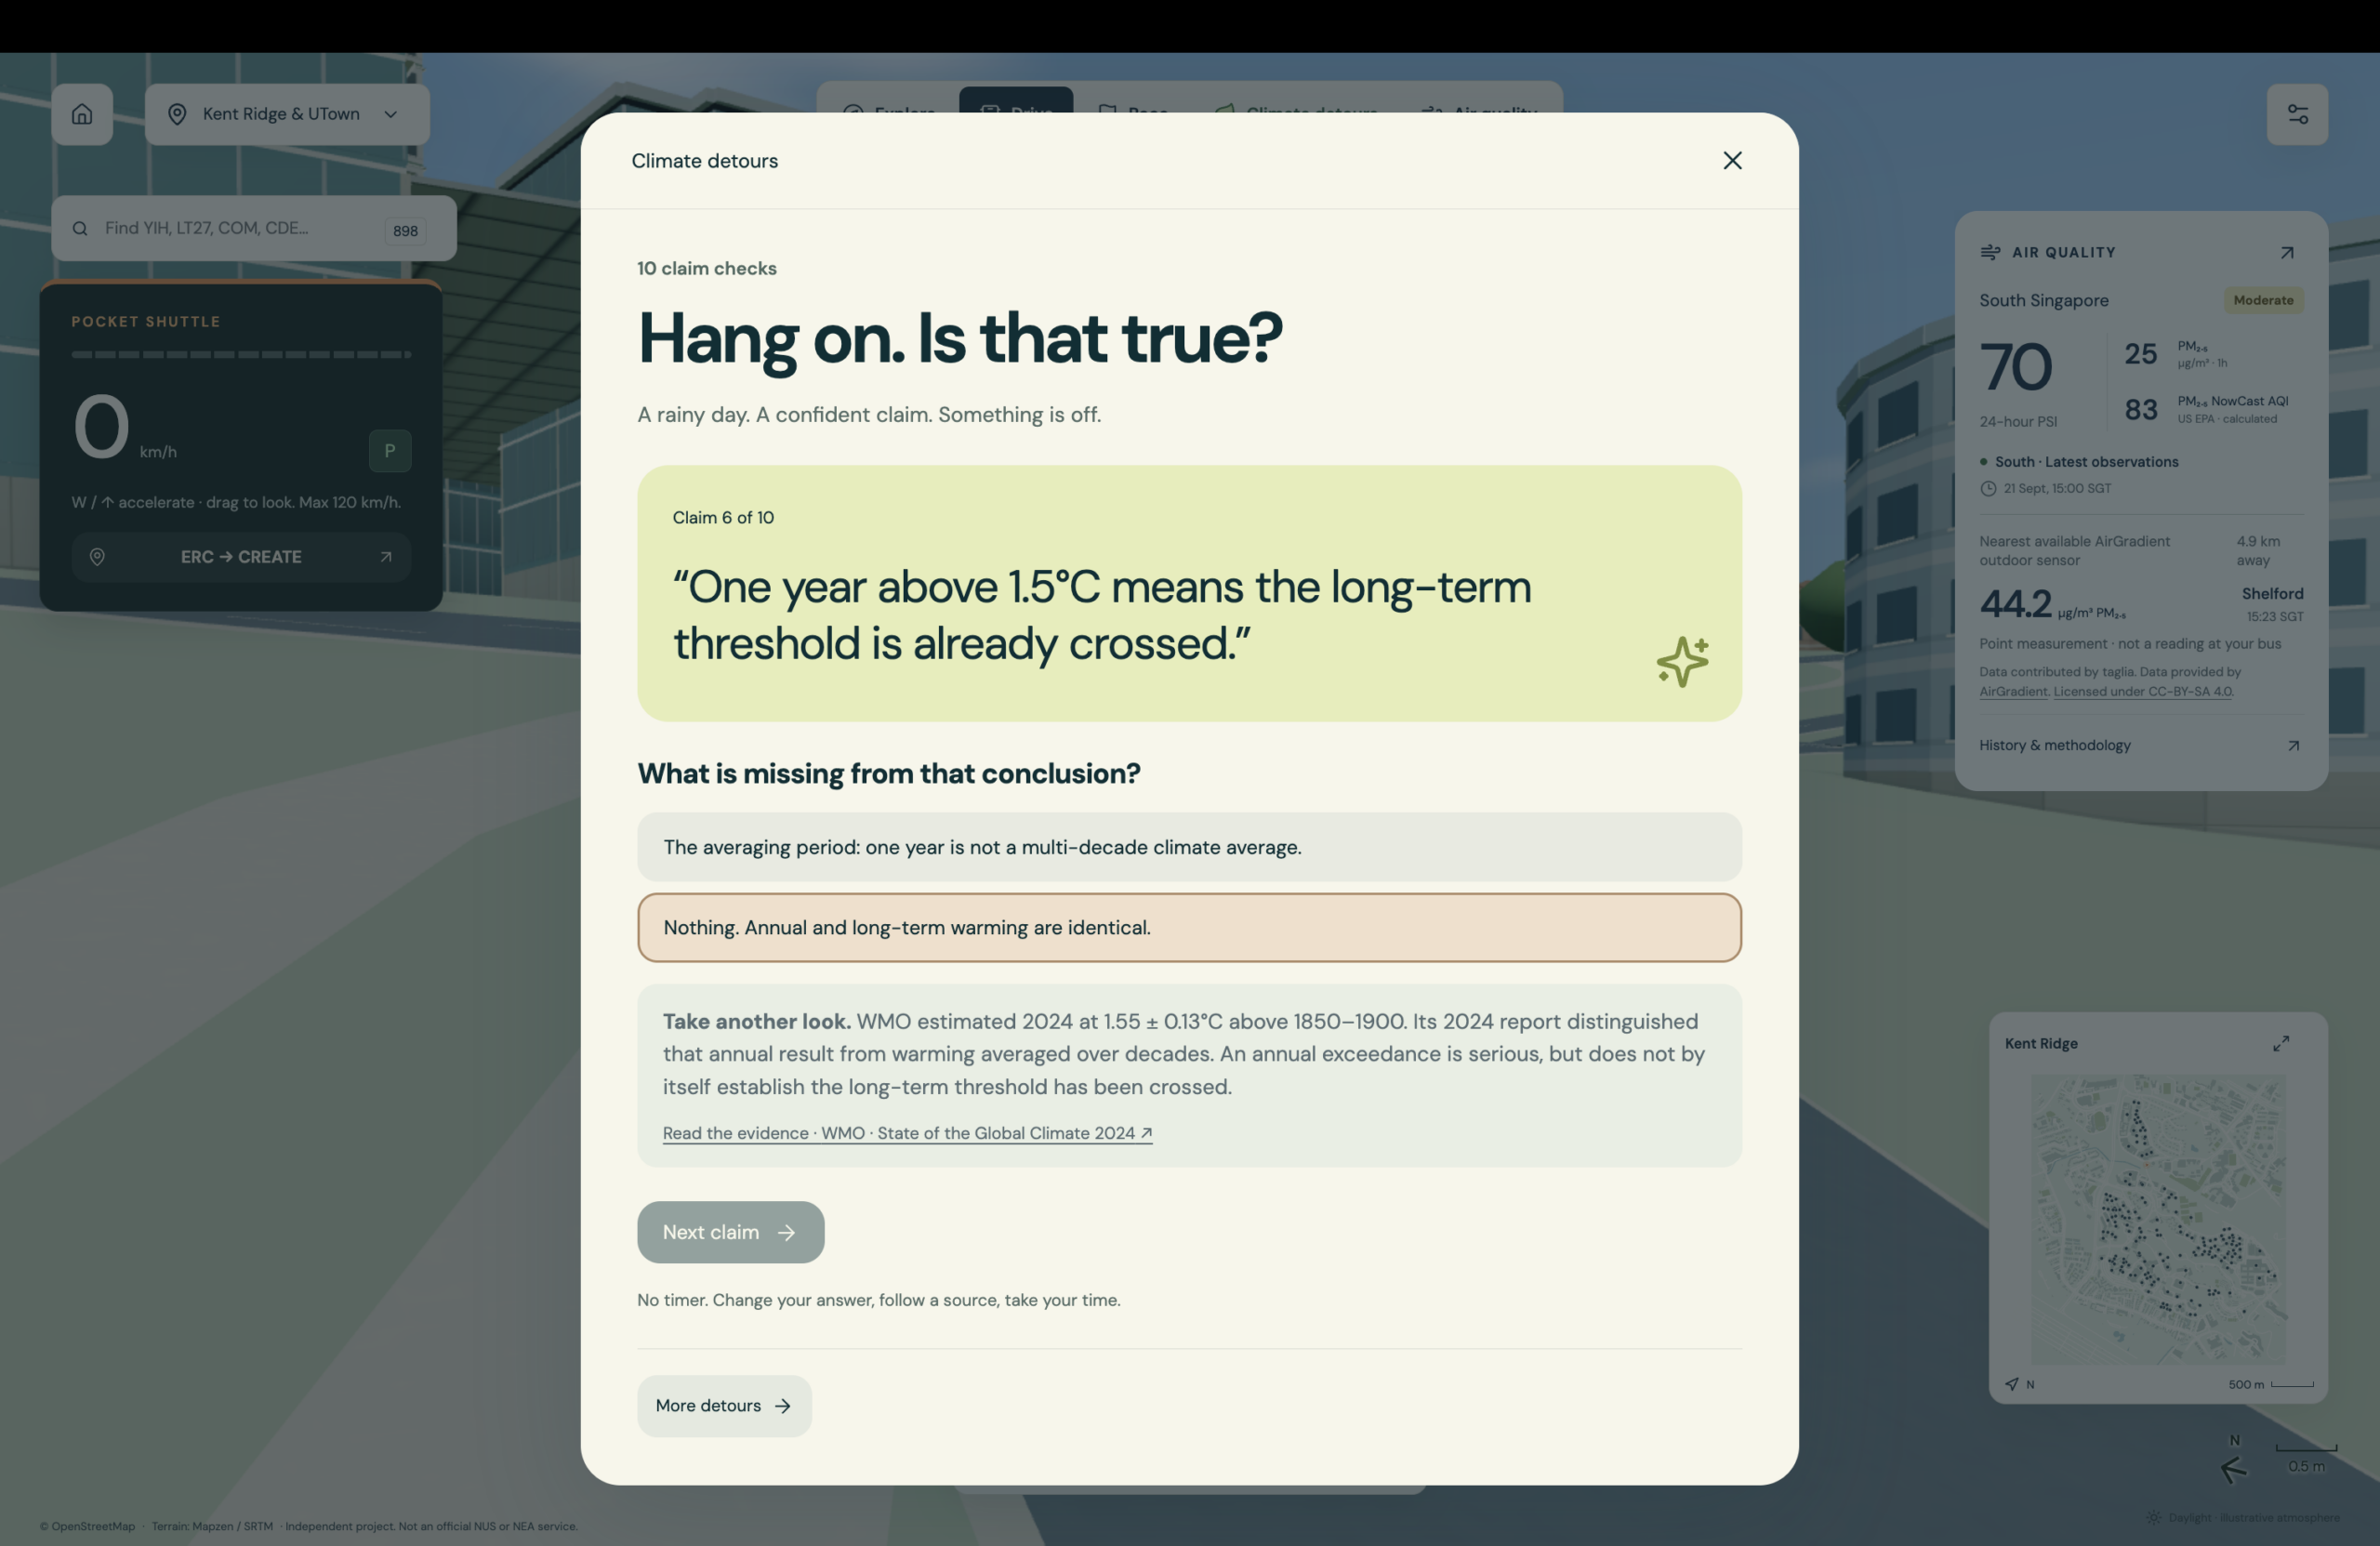
In “Hang on. Is that true?”, players test 10 confident claims, such as “It rained today. So much for global warming,” and each answer links to its source.
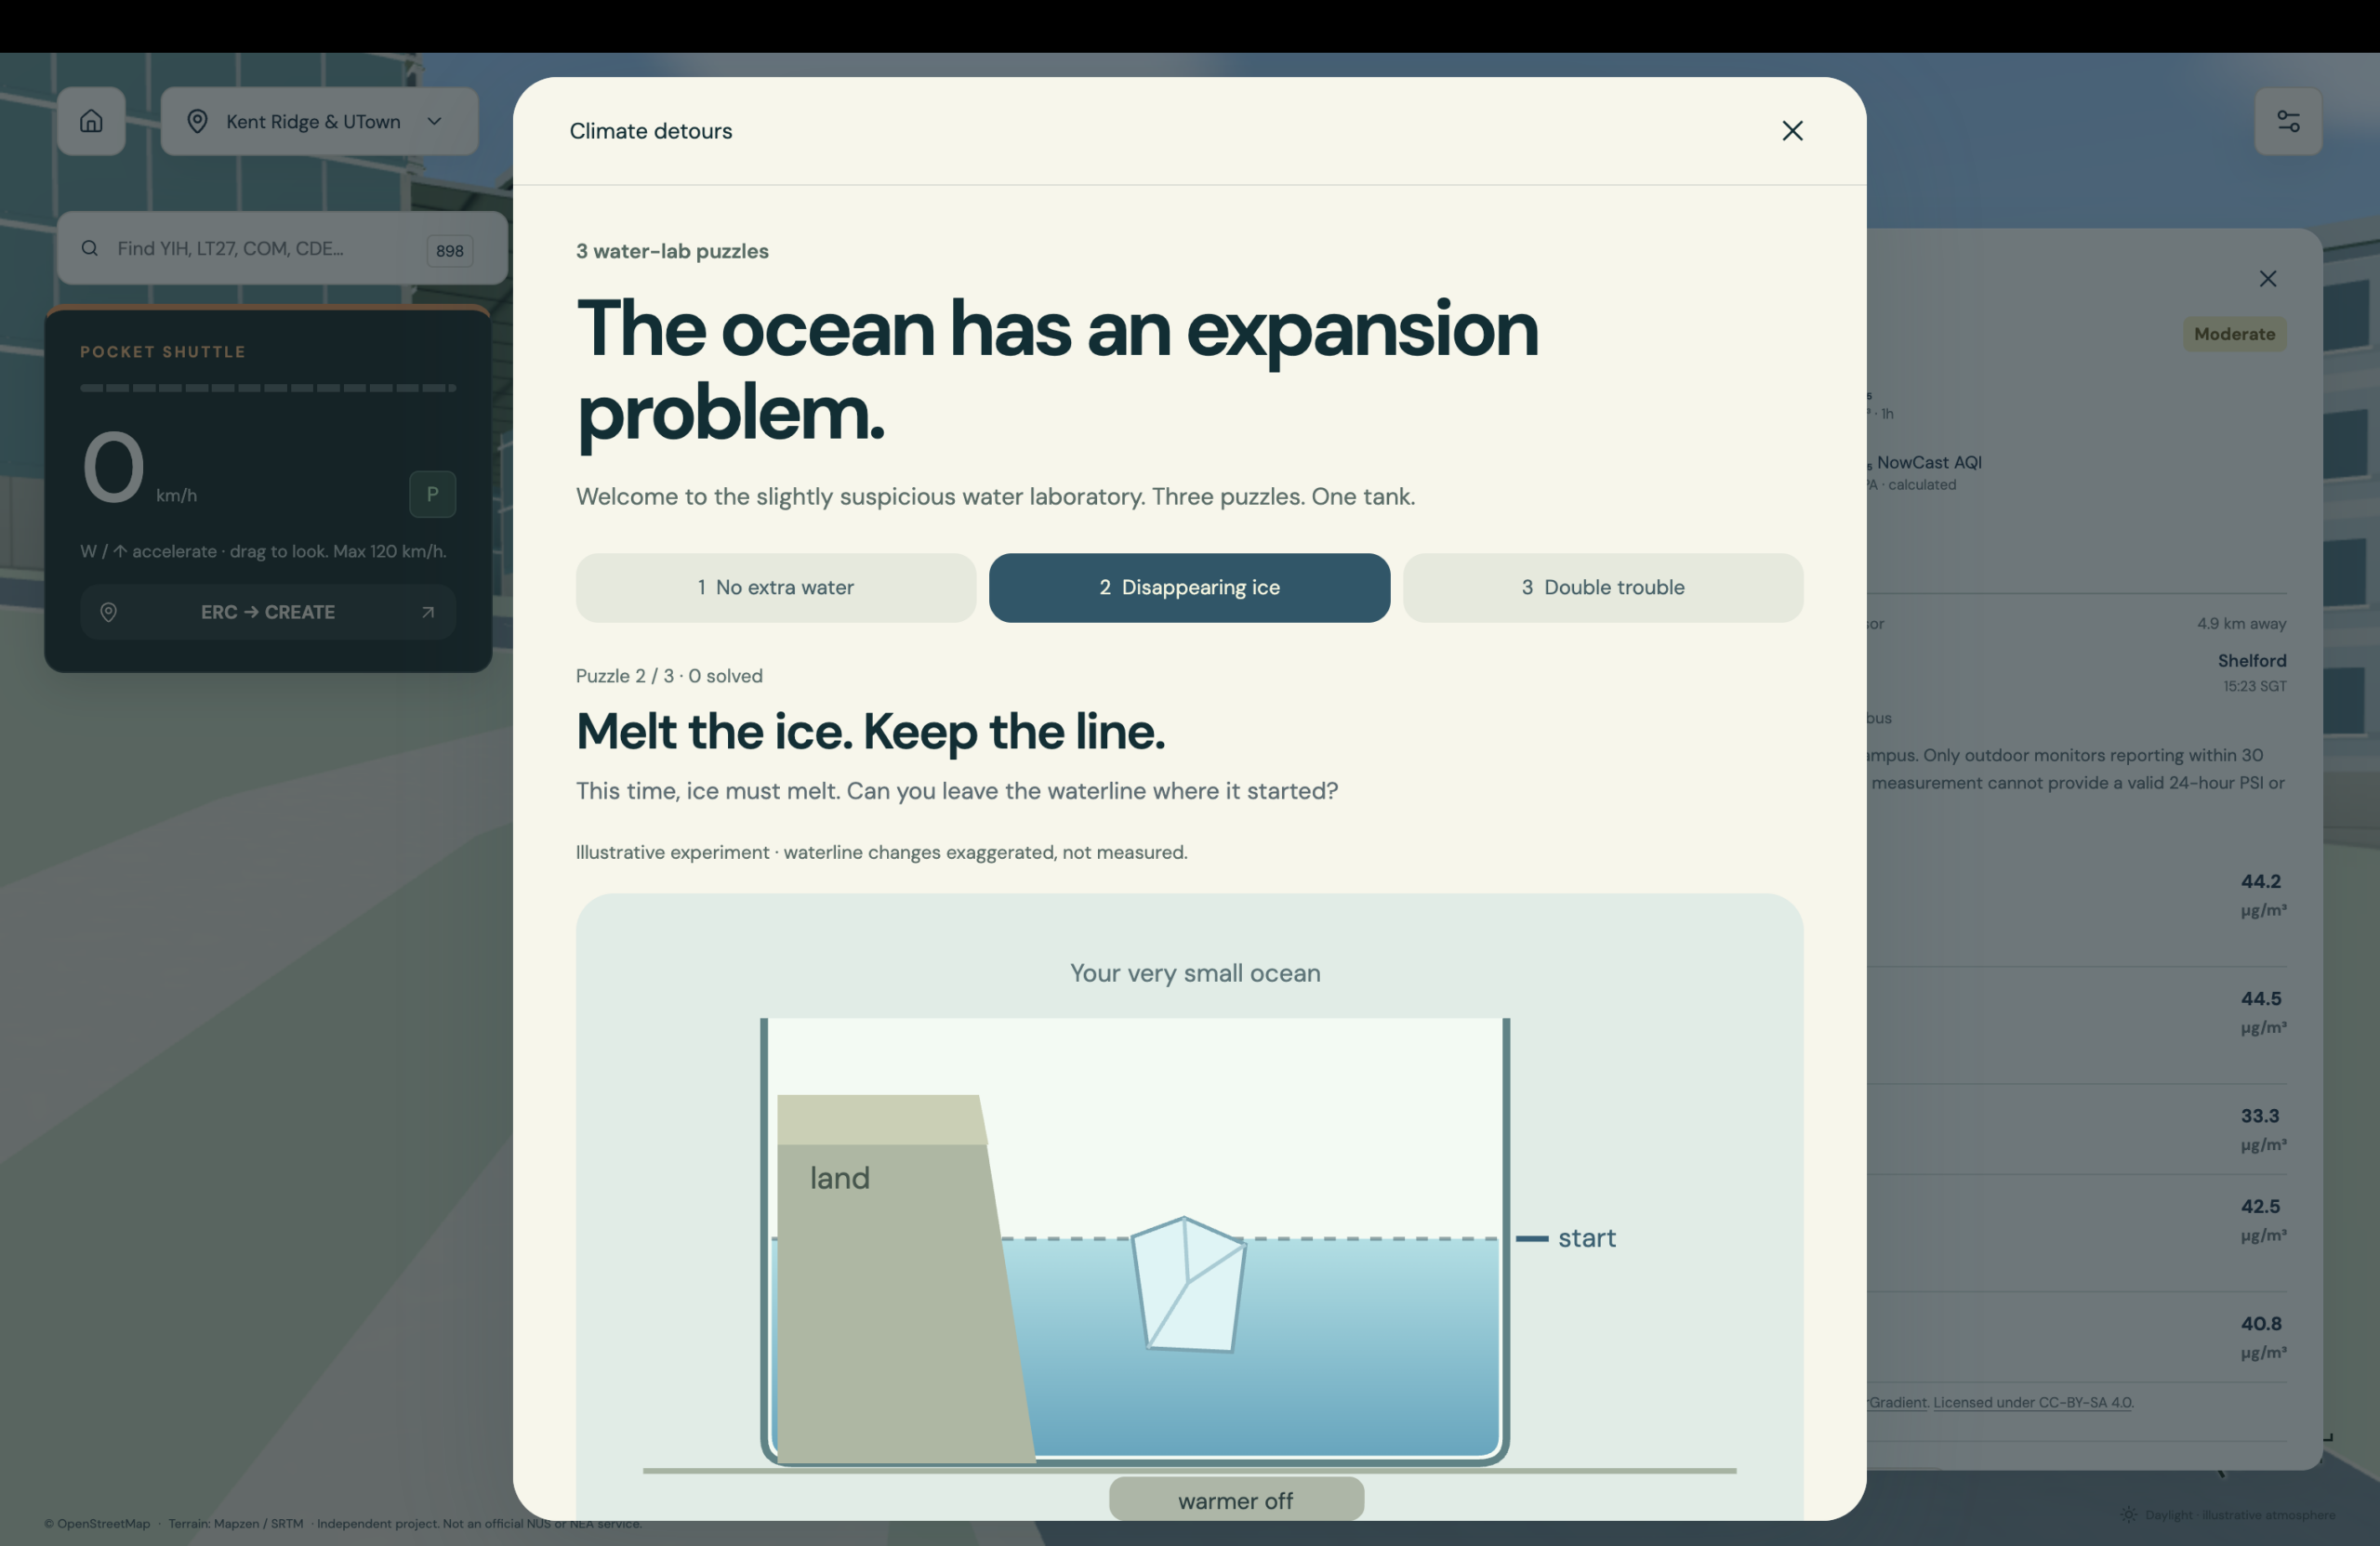
In the sea-level lab, you raise a waterline without adding water by warming it. A note above the tank says the changes are exaggerated and not measured. At true scale, he says, they would be too small to see on a phone. The glacier activity uses figures from the GlaMBIE study, published in Nature in February 2025: an average of 231 billion tonnes of ice lost a year from 2000 to 2011, and 314 billion tonnes a year from 2012 to 2023.
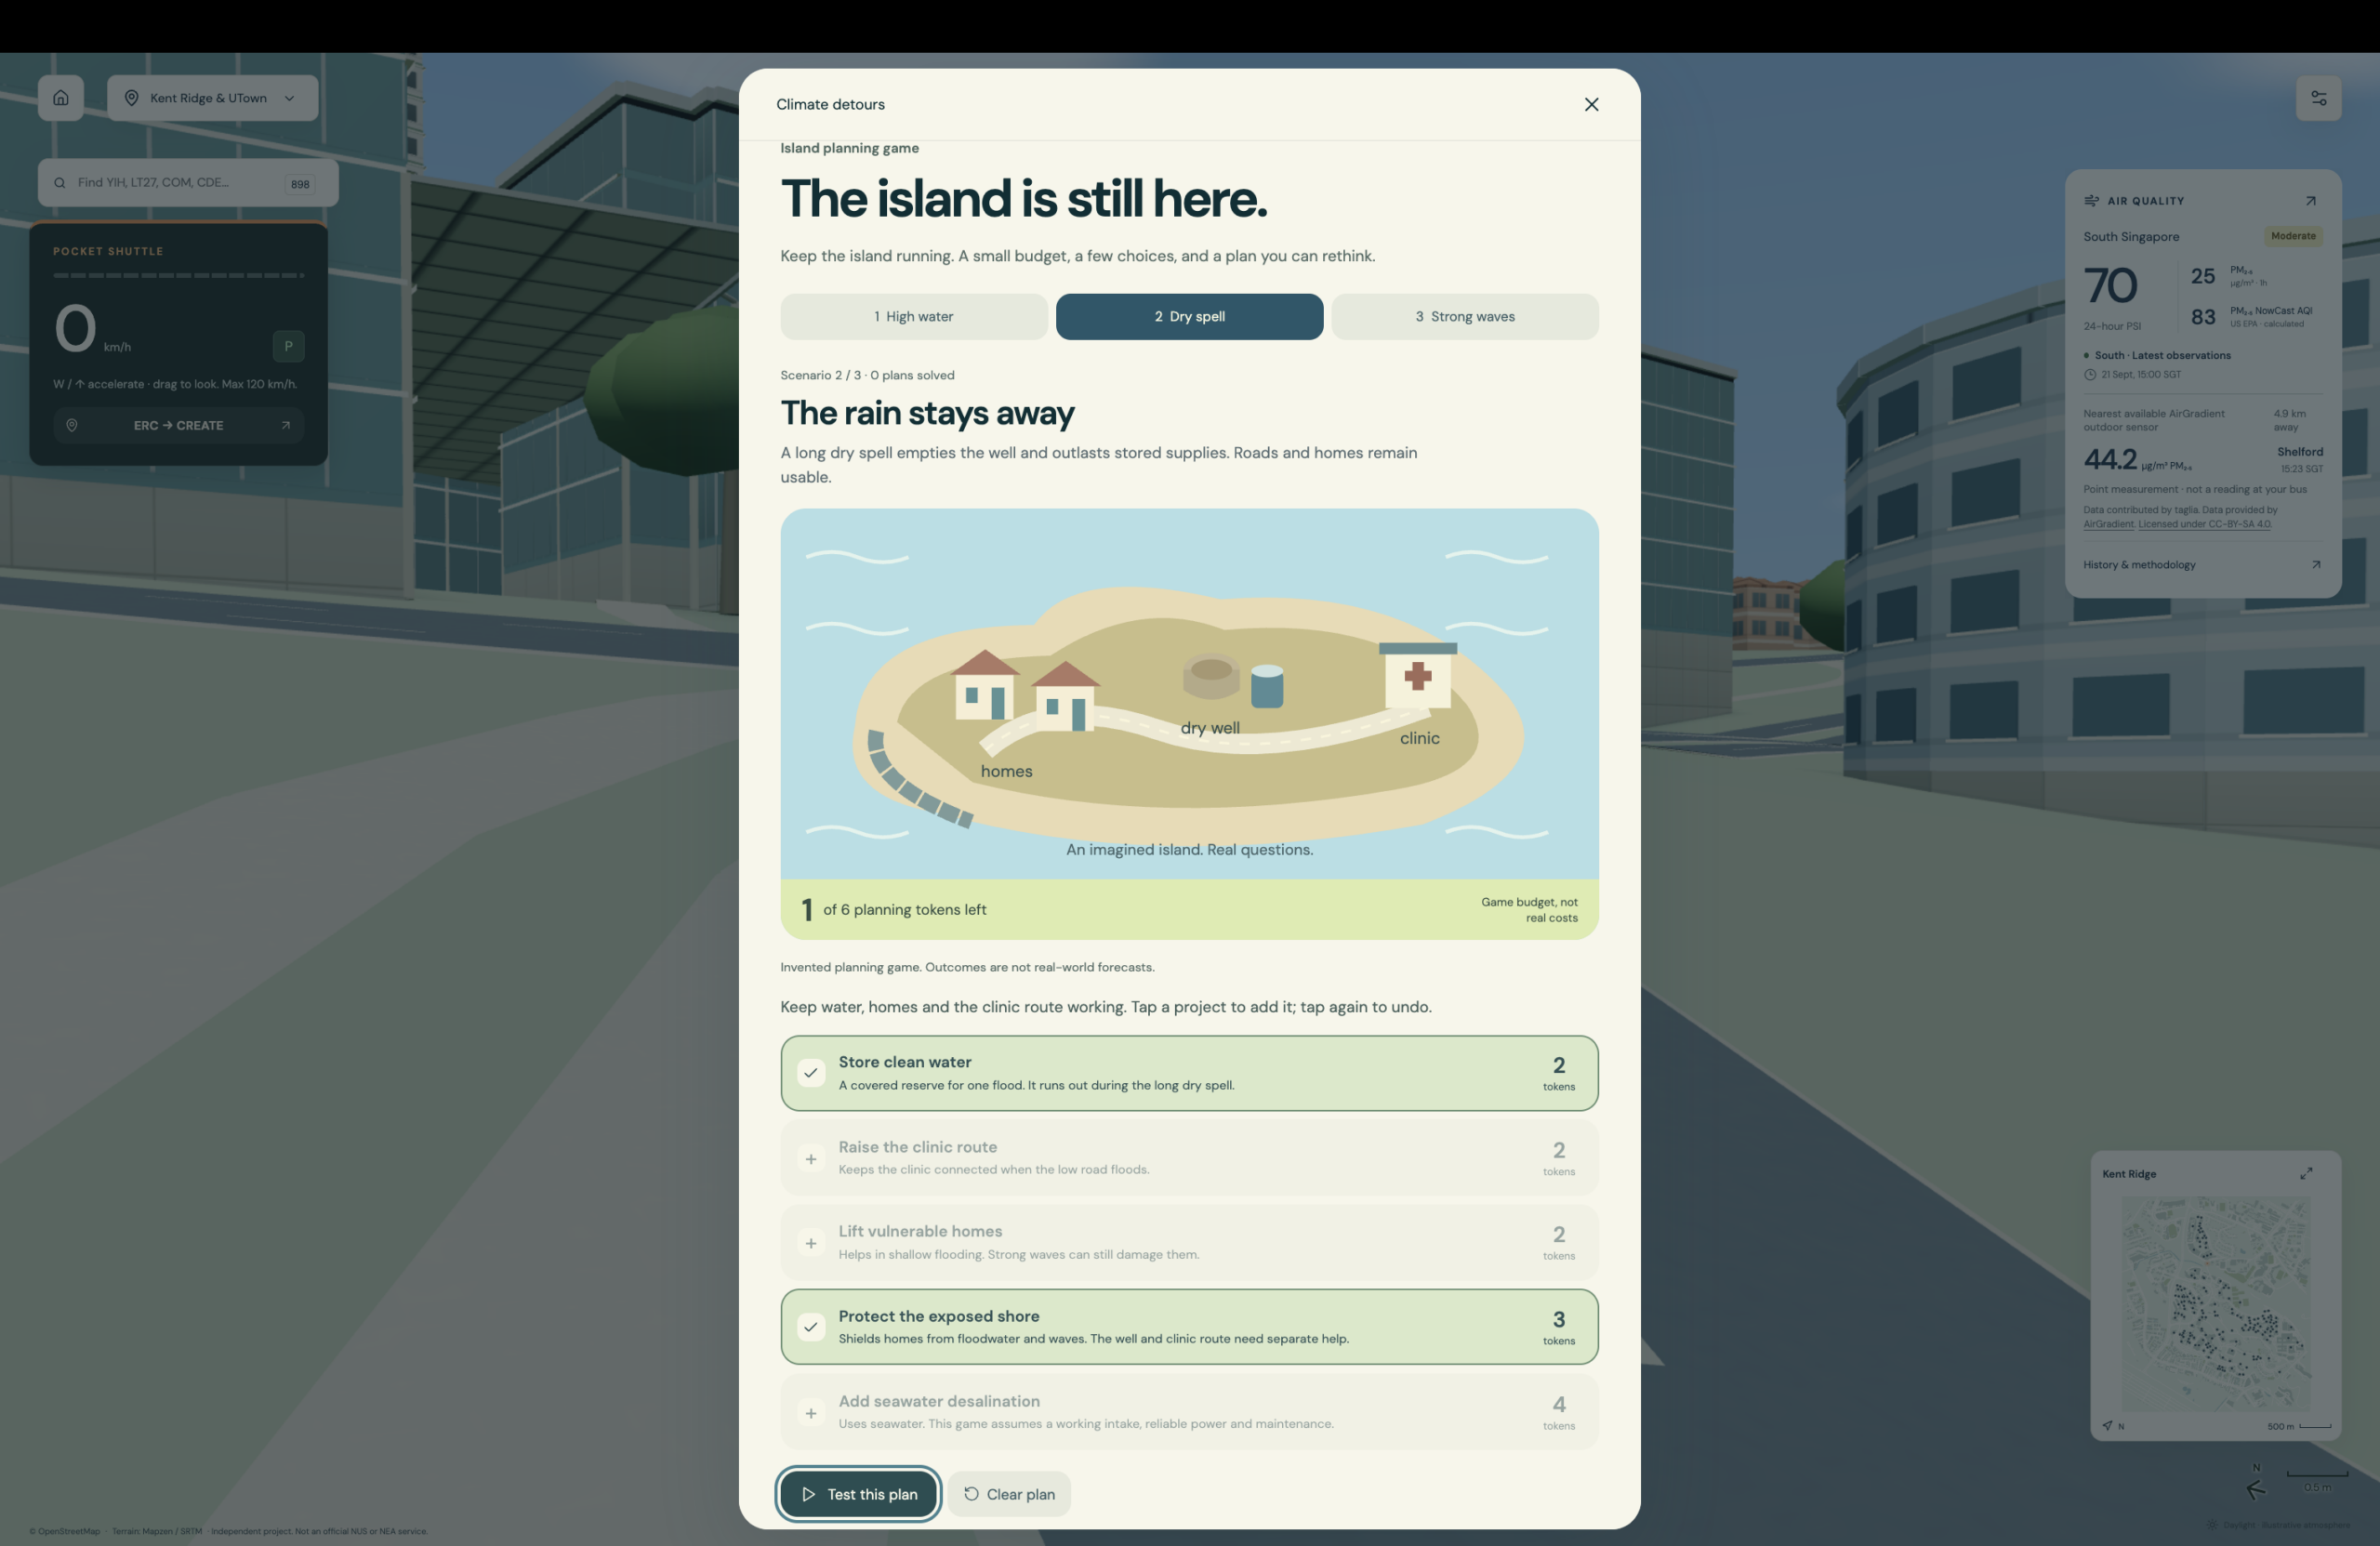
In the island game, players split a small budget between clean water, the road to the clinic, homes and the shoreline, then face high water, a dry spell or strong waves. The risks come from IPCC research. The island and its costs are invented, and the game says so.
Next, he wants the site to run faster on phones and improve its accessibility. NUS was only the first map. He hopes to do the same for other streets and other coastlines.
“I know one student’s website will not fix climate change,” Ambar says. “Perhaps someone arrives to race a tiny bus, stays long enough to question an air-quality number and leaves noticing something that had previously faded into the background.”
Explore Planet Out Loud at www.planetoutloud.com.
















Assistant Professor Yair Zick: Ethics in Artificial Intelligence